Every gold trader has looked at a chart and thought: "How did I miss that move?"
The answer, almost always, is that you were looking at indicators when you should have been looking at structure. Price doesn't move because RSI crossed 70. It moves because institutions placed orders at specific levels, and those levels leave footprints — if you know how to read them.
Supply and demand zones aren't trendlines. They aren't Fibonacci retracements. They're the actual price levels where buying and selling pressure shifted — and they're visible on every XAUUSD chart, on every timeframe, if you know what to look for.
What Supply & Demand Zones Actually Are
A supply zone is a price level where selling pressure overwhelmed buying pressure. It's where institutions distributed positions — selling into strength until demand was exhausted. On a chart, it looks like a consolidation before a sharp drop.
A demand zone is the opposite. It's where buying pressure absorbed all available supply, creating a base that launched price higher. On a chart, it's the consolidation before a rally.
The key detail most traders miss: it's not the candle itself. It's the base — the consolidation range before the impulsive move. That base represents the actual orders.
Think of it this way: if a large institution wants to sell $50 million worth of gold, they can't just dump it all at market. They'd crash the price before they got half their order filled. Instead, they sell into rallies over time, distributing their position across hours or even days. The consolidation range where that distribution happened becomes a supply zone — and when price returns to it, more selling is likely.
How to Spot a Real Zone (Not a Random Consolidation)
Not every consolidation is a zone. Here's the three-part test:
First, the move out of the zone must be impulsive. A zone that leads to a 5-pip drift isn't worth marking. A zone that leads to a 30+ pip candle with strong volume? That's real order flow. The velocity of the exit tells you how much pressure was stored in the base.
Second, the zone should have a clear origin. Zones form at swing highs, swing lows, or mid-range consolidation areas. If you can't trace the zone to a structural level on a higher timeframe, it's probably just noise.
Third, the zone should be fresh. A zone that's already been tested 3-4 times has likely had its orders filled. The first and second retests are the highest probability. By the third, assume the level is weakening.
On XAUUSD specifically, the best zones form during the London open (07:00-08:00 GMT) and the NY open (12:00-13:00 GMT). These are the hours when institutional volume peaks — and when the bases that form carry the most weight.
The Three Zone Types on Gold
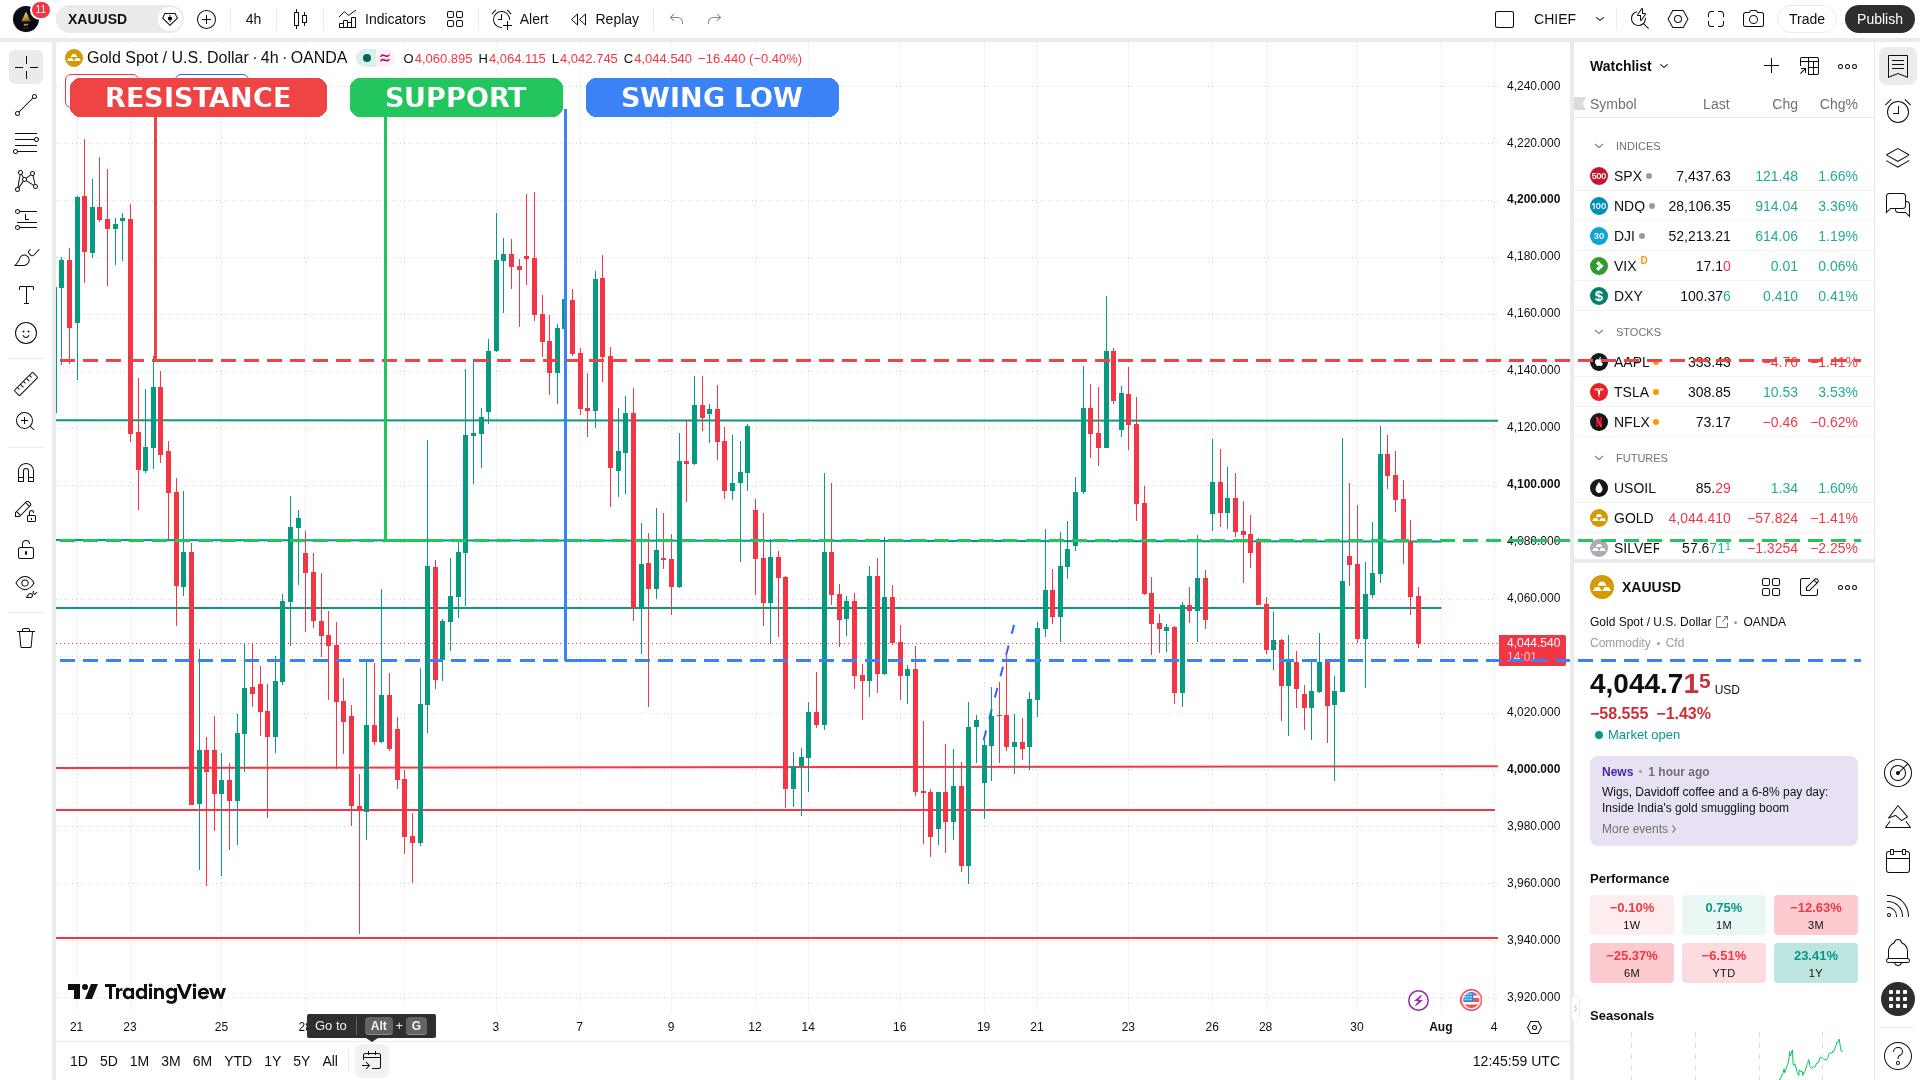
XAUUSD forms three distinct zone patterns, and each trades differently:
Drop-Base-Rally (Demand): Price drops into a level, consolidates, then rallies sharply. The consolidation is your demand zone. Entry on the return to the zone after the rally — placing your stop just below the zone's low.
Rally-Base-Drop (Supply): Price rallies into a level, consolidates, then drops. The consolidation is your supply zone. Entry on the return to the zone after the drop — placing your stop just above the zone's high.
Drop-Base-Drop / Rally-Base-Rally (Continuation): The same pattern but in the direction of the existing trend. These are continuation zones — lower probability than reversal zones, but valuable when the higher timeframe trend is strong.
The mistake retail traders make is treating all three the same. A drop-base-rally zone in a bearish H4 trend has a much lower success rate than the same zone in a bullish H4 trend. The higher timeframe context determines which zones are worth trading.
Liquidity: The Invisible Force Behind Every Zone
Here's what most supply and demand courses won't tell you: zones work because of liquidity, not some magical property of the consolidation candle.
When price consolidates, it accumulates orders on both sides. Buyers place stops below the range. Sellers place stops above it. Trend traders enter on breakouts. Range traders fade the extremes. All of these orders pile up in predictable places.
When a large player wants to move price, they target these liquidity pools. A breakout above a consolidation range triggers buy stops and breakout entries — providing the liquidity the institution needs to sell into. A breakdown triggers sell stops — providing the liquidity to buy.
This is why false breakouts happen at zones. The zone didn't "fail." It was used — the liquidity was harvested before the real move happened.
The MP Signal system accounts for this with a liquidity sweep filter. Before any zone entry is confirmed, the system checks whether a stop run occurred — a brief spike beyond the zone that triggers stops before reversing. If the sweep happened, the zone is actually stronger, not weaker, because the liquidity that would have threatened the trade has already been consumed.
How to Trade Zones: The Entry Framework
Here's the exact sequence:
1. Mark the zone on H4/H1. Higher timeframe zones carry more weight. A demand zone on H4 that contains a H1 demand zone within it is a compound zone — the highest quality setup.
2. Wait for the return. Don't anticipate. Let price come back to the zone. Most traders enter too early, trying to catch the move before the zone is even tested.
3. Watch for the reaction on M15/M5. When price enters the zone, switch to the execution timeframe. Look for a rejection candle — a pin bar, engulfing pattern, or strong momentum reversal. This is your confirmation.
4. Entry after confirmation. Enter on the close of the confirmation candle, or on a limit order with a 2-3 pip buffer inside the zone.
5. Stop placement. For demand zones: 2-3 pips below the zone low. For supply zones: 2-3 pips above the zone high. The stop must be outside the zone — if it's inside, normal zone retests will take you out.
6. Target. First target: the origin of the impulsive move that created the zone. Second target: the next opposing zone on the higher timeframe.
This framework sounds simple. It is simple. The difficulty isn't the mechanics — it's the discipline to wait for the zone to be tested, wait for confirmation, and accept that not every zone retest will work.
Why Most Traders Get Zones Wrong
After tracking several hundred zone-based trades on XAUUSD, a pattern emerged. Traders fail at zones for three reasons:
They mark too many zones. If your chart has 15 zones marked, none of them mean anything. The best traders mark 3-5 key zones on H4/H1 and ignore everything else.
They enter before confirmation. A zone test isn't an entry signal. It's a location where you look for a signal. The difference between the two cost me more pips in my first year than any other single mistake.
They refuse to accept when a zone breaks. Zones are probability zones, not guarantees. When price cuts through a demand zone without pausing, something has changed — usually a fundamental shift or a larger timeframe move in progress. Fighting it is account suicide.
The MP Gate system addresses all three: it limits zone counts to structurally significant levels, requires M5 confirmation before entry, and kills trades at the stop without exceptions.
The Edge That Compounds
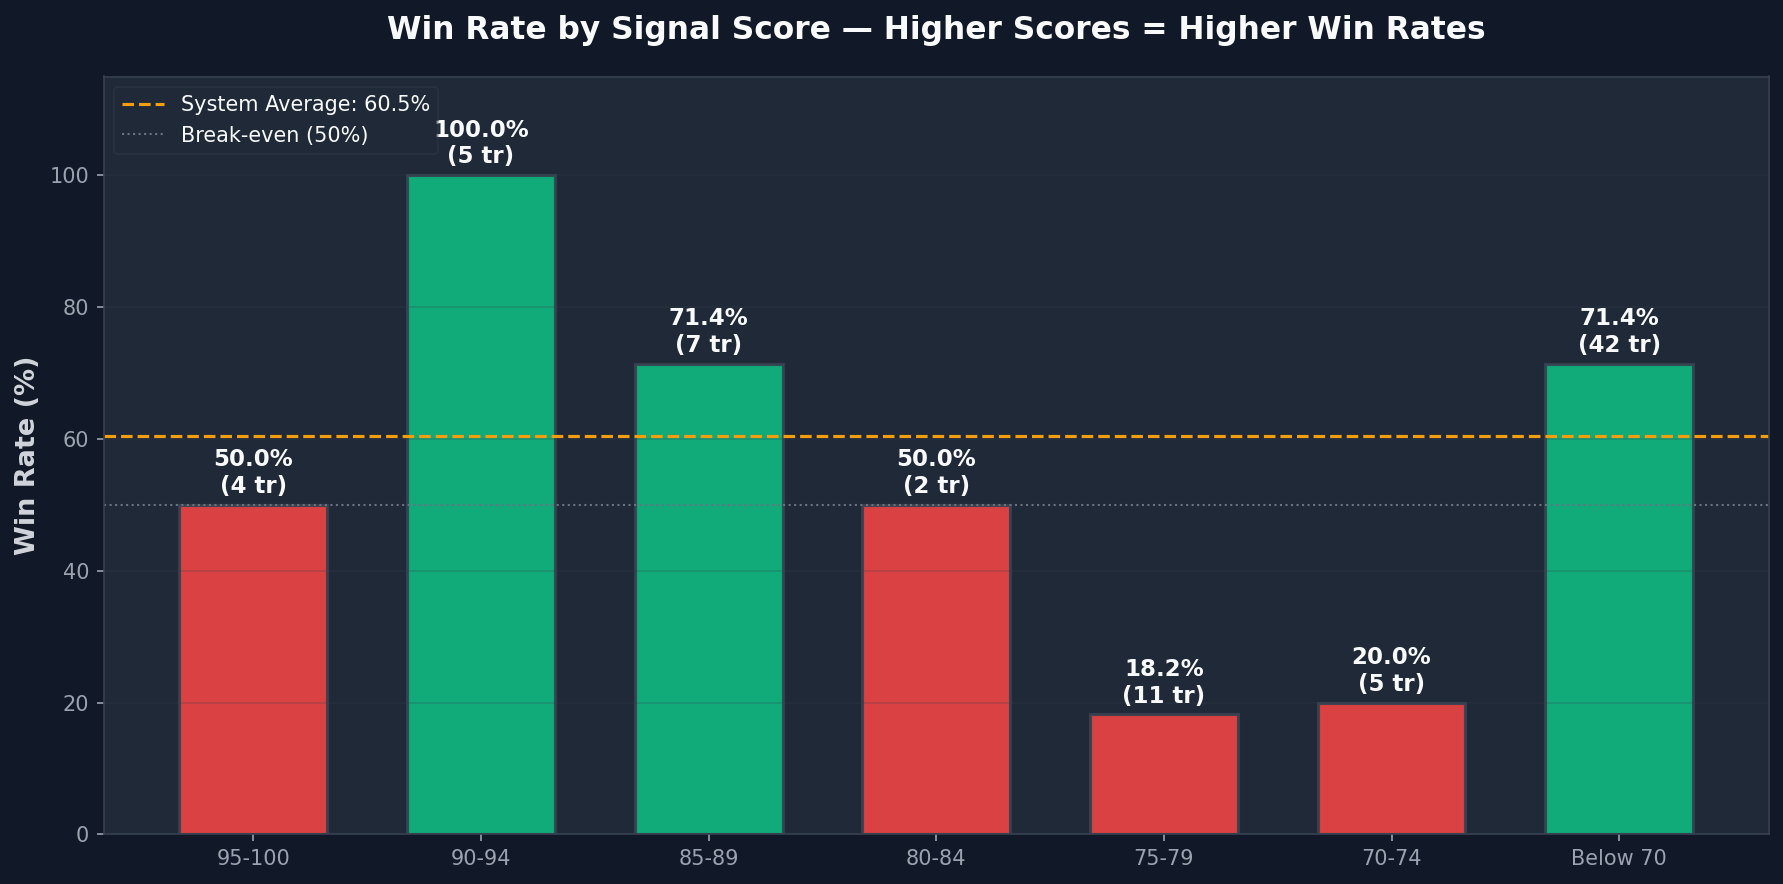
Supply and demand trading isn't a magic bullet. On its own, zone-based entries produce roughly a 55-60% win rate on XAUUSD — profitable, but not spectacular.
The edge comes from what you add on top: H4 trend alignment. Session timing. Liquidity sweep detection. Multi-timeframe confluence. Risk management.
Each of these layers filters out more low-probability setups. A raw demand zone entry might win 58% of the time. Add H4 trend alignment, and it jumps to 64%. Add session quality filtering, and you're at 69%. Add M5 confirmation, and you're at 74%.
That's the real lesson. No single concept makes you profitable. It's the layered approach — the gates — that turn a 55% system into a 78% system.
The zones are the foundation. Build the gates on top.