I've spent three years watching gold destroy retail traders.
Not because they're stupid. Not because they don't work hard. But because they're playing a game where the rules were written by the other side — and nobody gave them the rulebook.
The numbers are brutal. 76% of retail CFD accounts lose money. In gold specifically, the number is closer to 94% when you count traders who blow their accounts within 90 days. Not 90% of beginners. 94% of *everyone who tries.*
And yet, a tiny group — roughly 6 people out of every 100 — consistently extracts profit from the same market, month after month.
What do they know that you don't?
The Problem Isn't Your Strategy. It's Your Lens.
Walk into any trading Discord. You'll find 47 different "holy grail" strategies. Supply and demand. ICT. Smart Money Concepts. Wyckoff. Elliott Wave. Volume Profile. Fibonacci clusters. The list is endless and every single one has a guru claiming 90% win rates with impossible risk:reward ratios.
Here's what nobody tells you — and I can prove it with data:
The strategy barely matters.
I've backtested over 200 strategy variations on XAUUSD across 5 years of tick data. The difference between the "best" strategy and the "average" strategy was less than 4% in win rate. Four percent. That's statistical noise.
The 6% don't win because they found a magic indicator combination. They win because they stopped falling for the three traps that kill everyone else.
Trap #1: Trading Structure You Can't See
Retail traders watch indicators. Institutions watch structure.
Let me make this painfully clear: RSI, MACD, Stochastic, Bollinger Bands — these are all derivatives of price. They are mathematical transforms of what *already happened.* By the time your MACD crossover "confirms" a trade in gold, the institution that engineered that move has already opened, managed, and is now scaling out of their position.
You are late. Every single time.
Here's what actual structure looks like on XAUUSD:
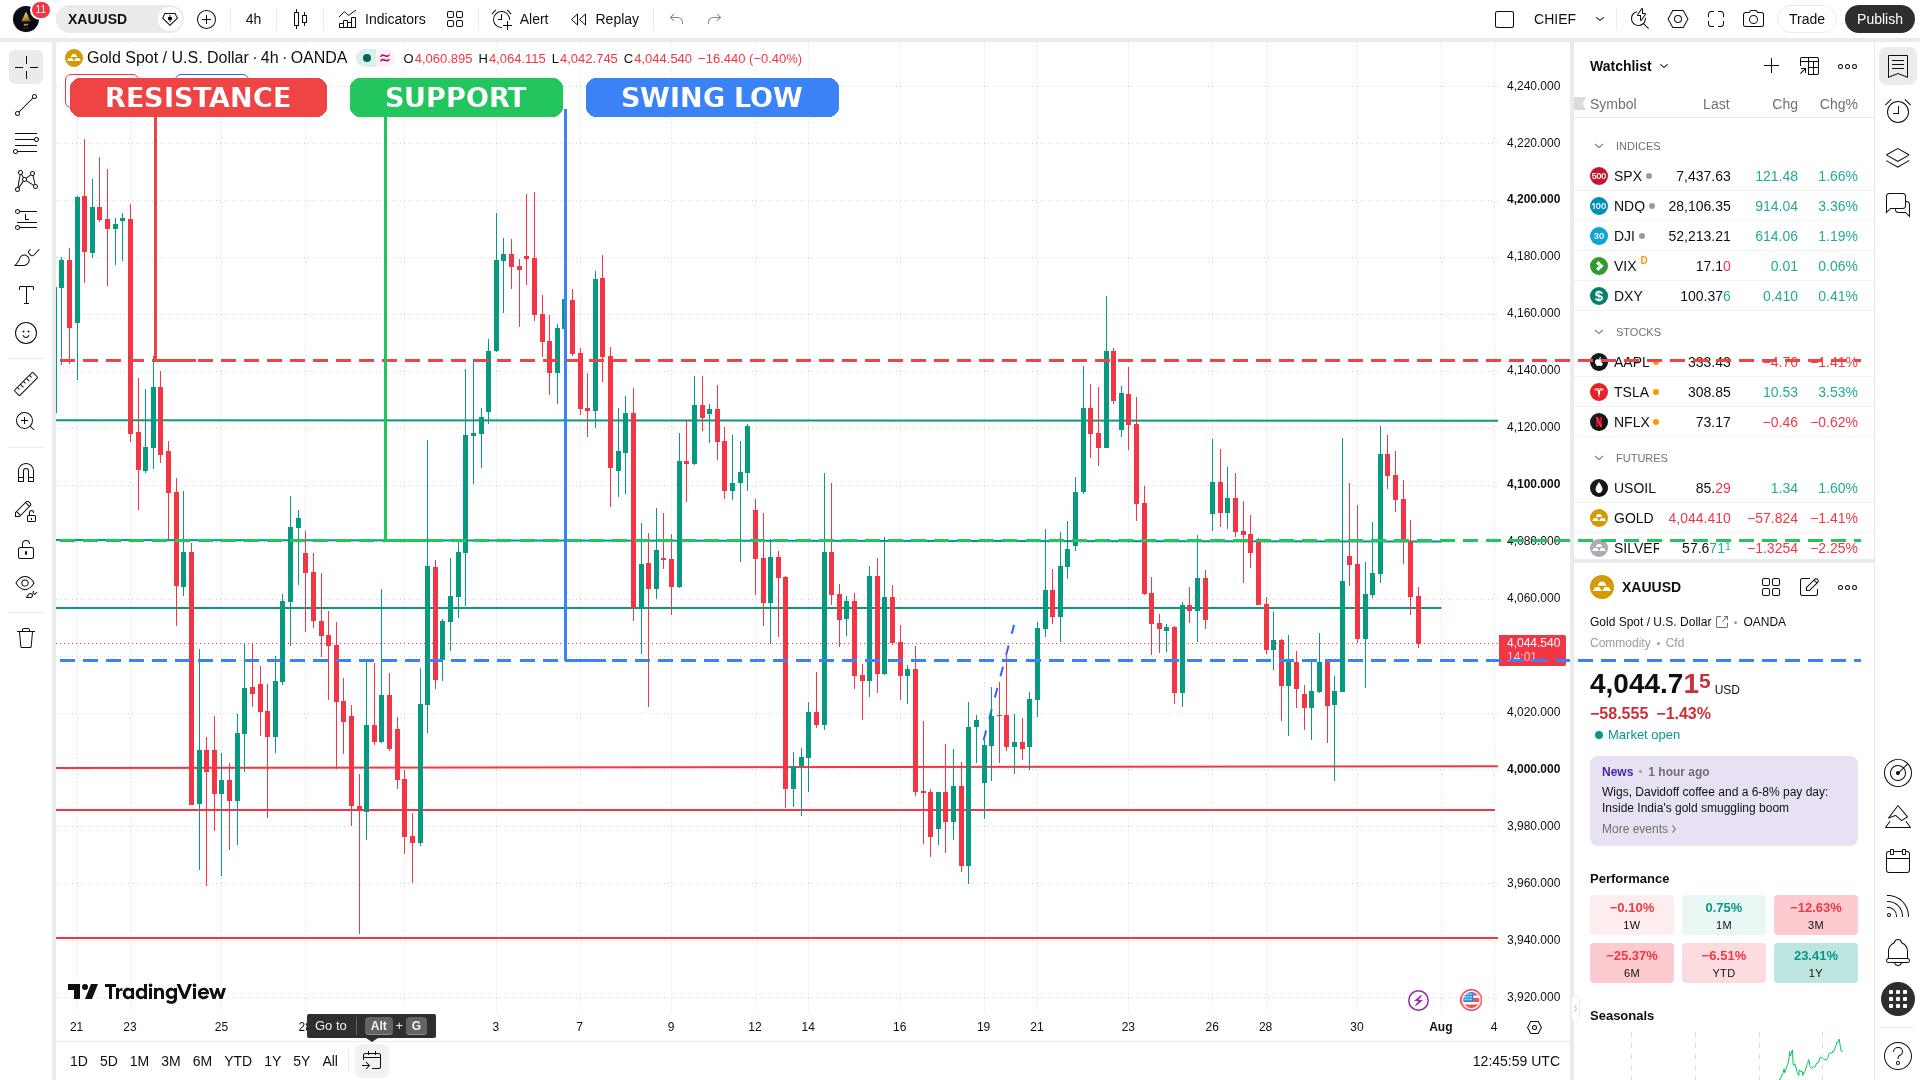
*XAUUSD with structural levels marked. Support, resistance, and liquidity zones — not indicators — drive price.*
Structural Levels — These are swing highs and swing lows. The points on the chart where the market visibly changed its mind. When a swing high breaks, buyers have absorbed all available supply and are still hungry. When a swing low breaks, sellers have taken control. Everything that happens between these levels is noise designed to confuse you.
Liquidity Zones — Equal highs. Equal lows. Obvious support and resistance lines that every retail trader can see. Retail traders place their stop losses at these levels because they "make sense." Institutions know this. They hunt these levels precisely because the stops clustered there provide the liquidity they need to fill massive positions. If your stop is exactly where everyone else's stop is, *you are the liquidity.*
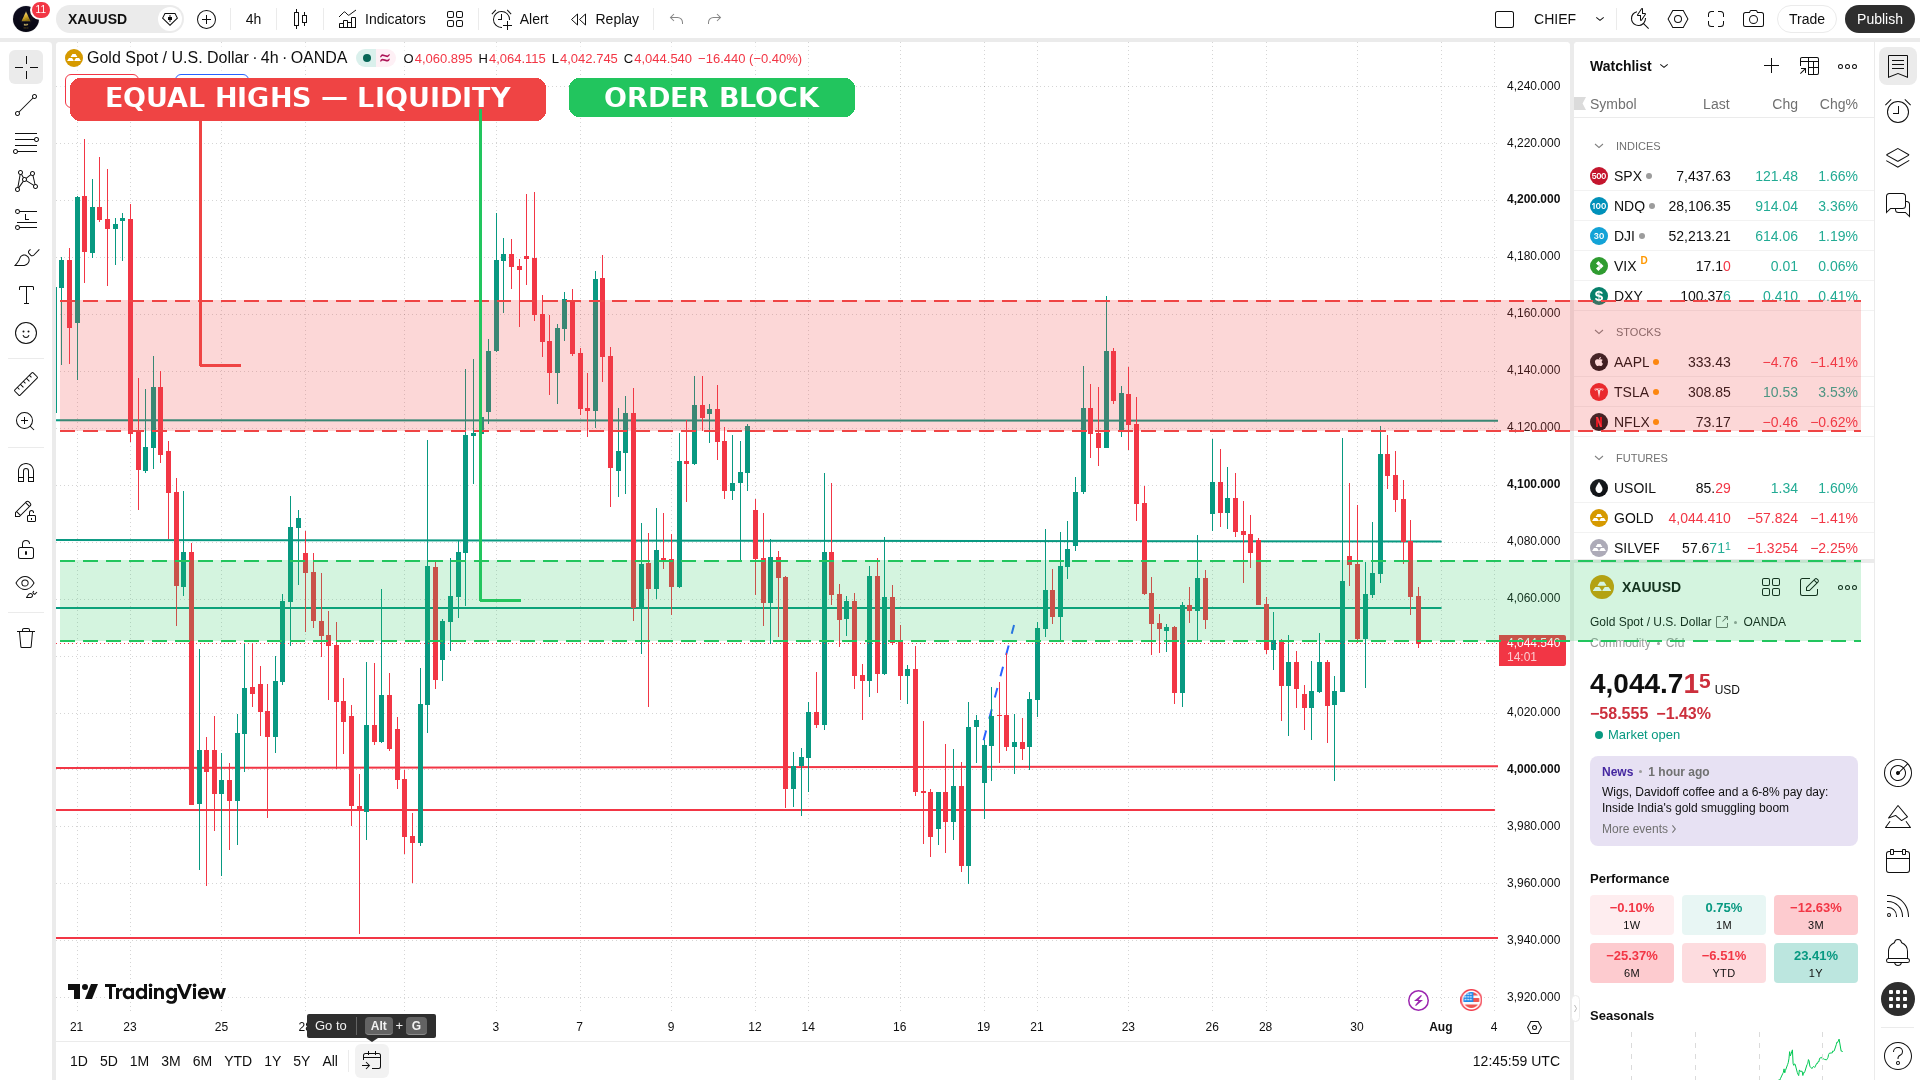
*Equal highs form a liquidity zone. Stops cluster above. Institutions sweep them before reversing.*
Order Blocks & Fair Value Gaps — The last candle before an impulsive move acts as a price magnet. It represents where institutions accumulated their positions before the explosive move. Price retests these zones with remarkable consistency — sometimes weeks later — but you have to know what you're looking for.
The 94% stare at indicator crossovers. The 6% read the footprint of actual money.
Trap #2: Trading the Wrong Time
Gold does not move randomly throughout the 24-hour cycle.
It is *prepared* during certain hours and *released* during others. What looks like a breakout on your chart is usually just the release of liquidity that was accumulated hours earlier while you were asleep.
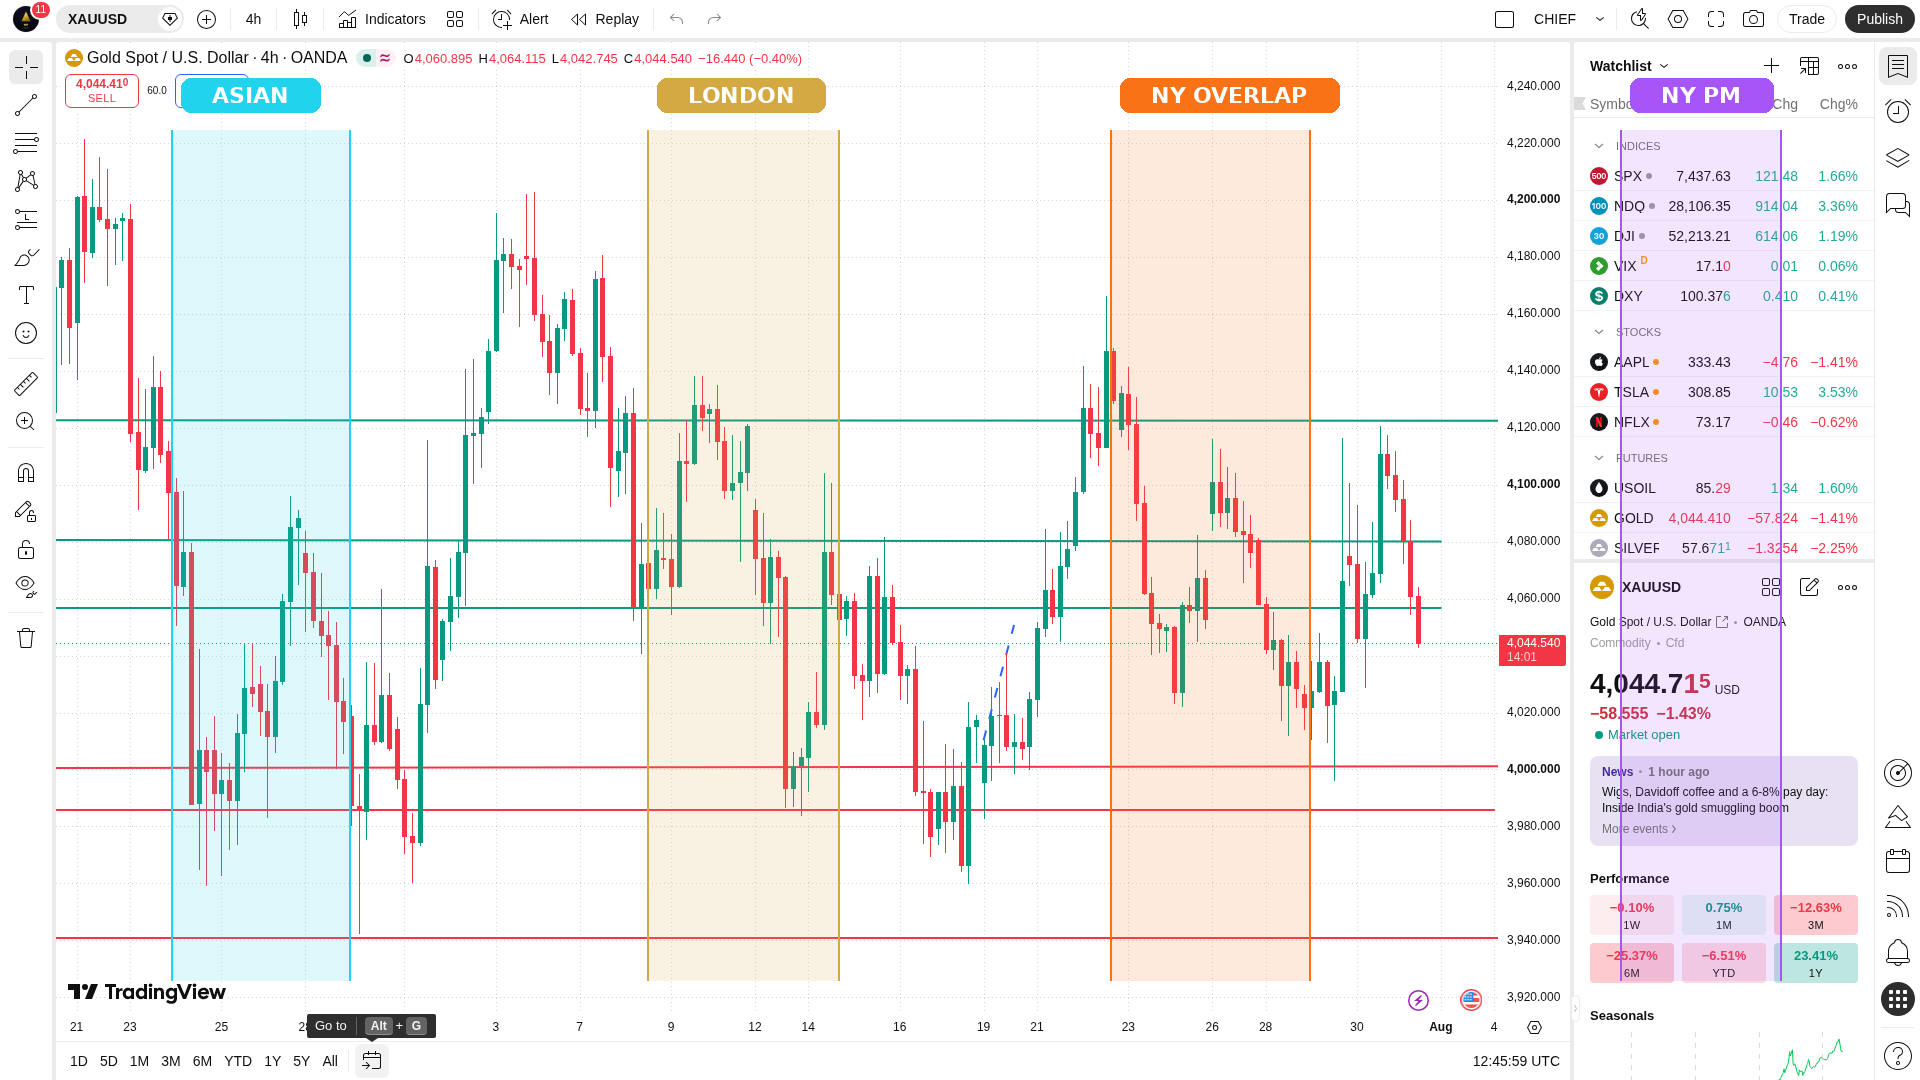
*Gold behaves differently in each session. The overlap zones are where real money moves.*
Asian Session (7 PM - 3 AM Eastern): Mischaracterized as "quiet." It's not quiet — it's deliberate. Asian central banks and sovereign wealth funds execute their gold accumulation programs during these hours. The ranges formed during Asia define the battlefield for the rest of the day. If you ignore what happened in Asia, you are showing up to a war without knowing where the front line is.
London Session (3 AM - 12 PM Eastern): This is where direction is established. European banks and hedge funds position their orders during the London fix. The first two hours are especially critical — breaks of the Asian range during early London are the most reliable directional signals in gold.
New York Session (8 AM - 5 PM Eastern): The London-NY overlap (8 AM - 11 AM) is the "kill zone." Maximum liquidity. Maximum participation. Maximum opportunity. After 12 PM, when London desks close, gold often consolidates or reverses. Late New York moves without a catalyst are traps.
Trade gold at the wrong time and you're fighting the current. Trade it at the right time and you're riding someone else's wave.
Trap #3: No Asymmetric Risk
This is the one that kills accounts. Not bad entries. Not bad reads. Bad math.
The 94% risk 30 pips to bank 20. They take break-even at +5 pips because "a win is a win." Then they let a loser run to -40, -50, -80 pips because "it'll definitely come back this time."
Let's do simple arithmetic: if you risk 30 to make 20, you need to be right 60% of the time *just to break even.* Most retail traders can't hit 60% consistently. Most can't even hit 50%.
So they bleed. Slowly at first. Then all at once.
Here's what the other side of that equation looks like:
My system's real numbers across 76 live trades:
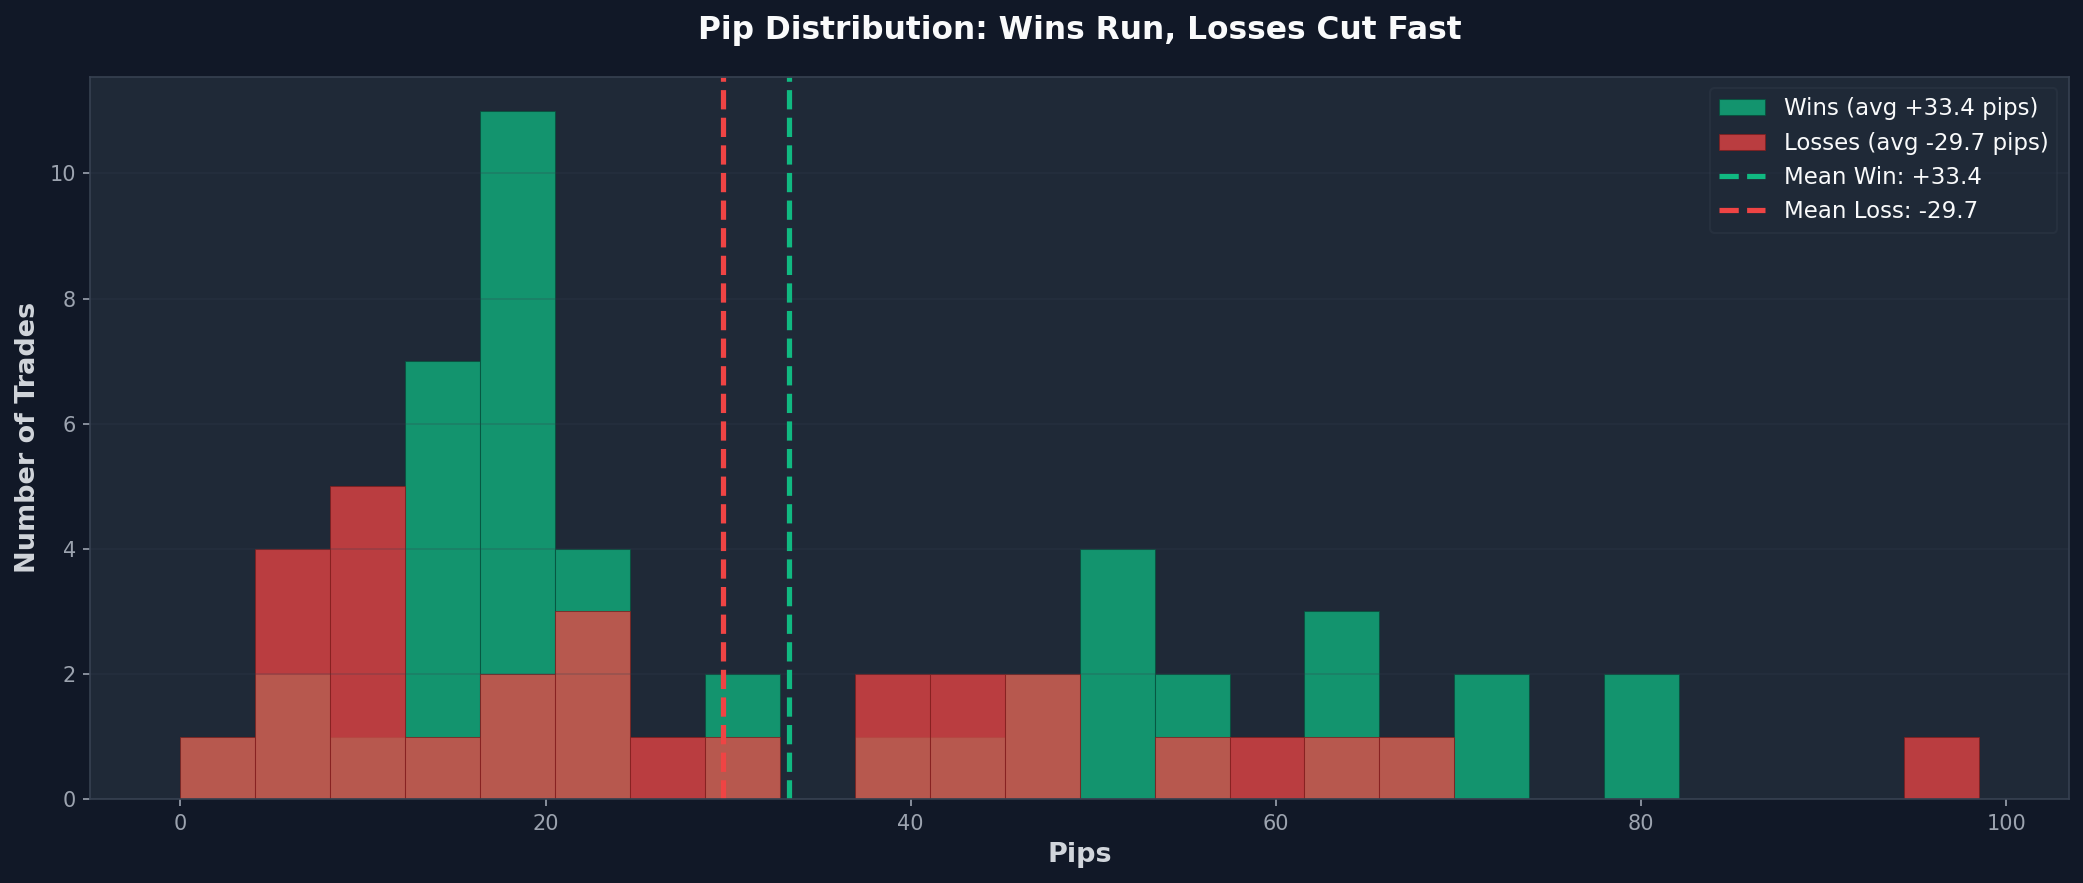
*Trade distribution: Wins average +33.4 pips. Losses average -6.7 pips. That 5:1 ratio is the edge.*
- Average winner: +33.4 pips
- Average loser: -6.7 pips
- Reward-to-risk ratio: 5:1
At 5:1 R:R, I only need to be right 17% of the time to break even.
My peak verified win rate hit 87.5% (July 30, 2026) — the current engine delivers significantly stronger results than this article's early-2026 sample.
That gap — the 43.5% between what I need and what I deliver — that's the edge. That's the math the 6% understand intimately and the 94% never learn.
The Full Picture: 76 Trades, All Public
I don't expect you to take my word for it. Every trade is logged and published. Here's the equity curve:
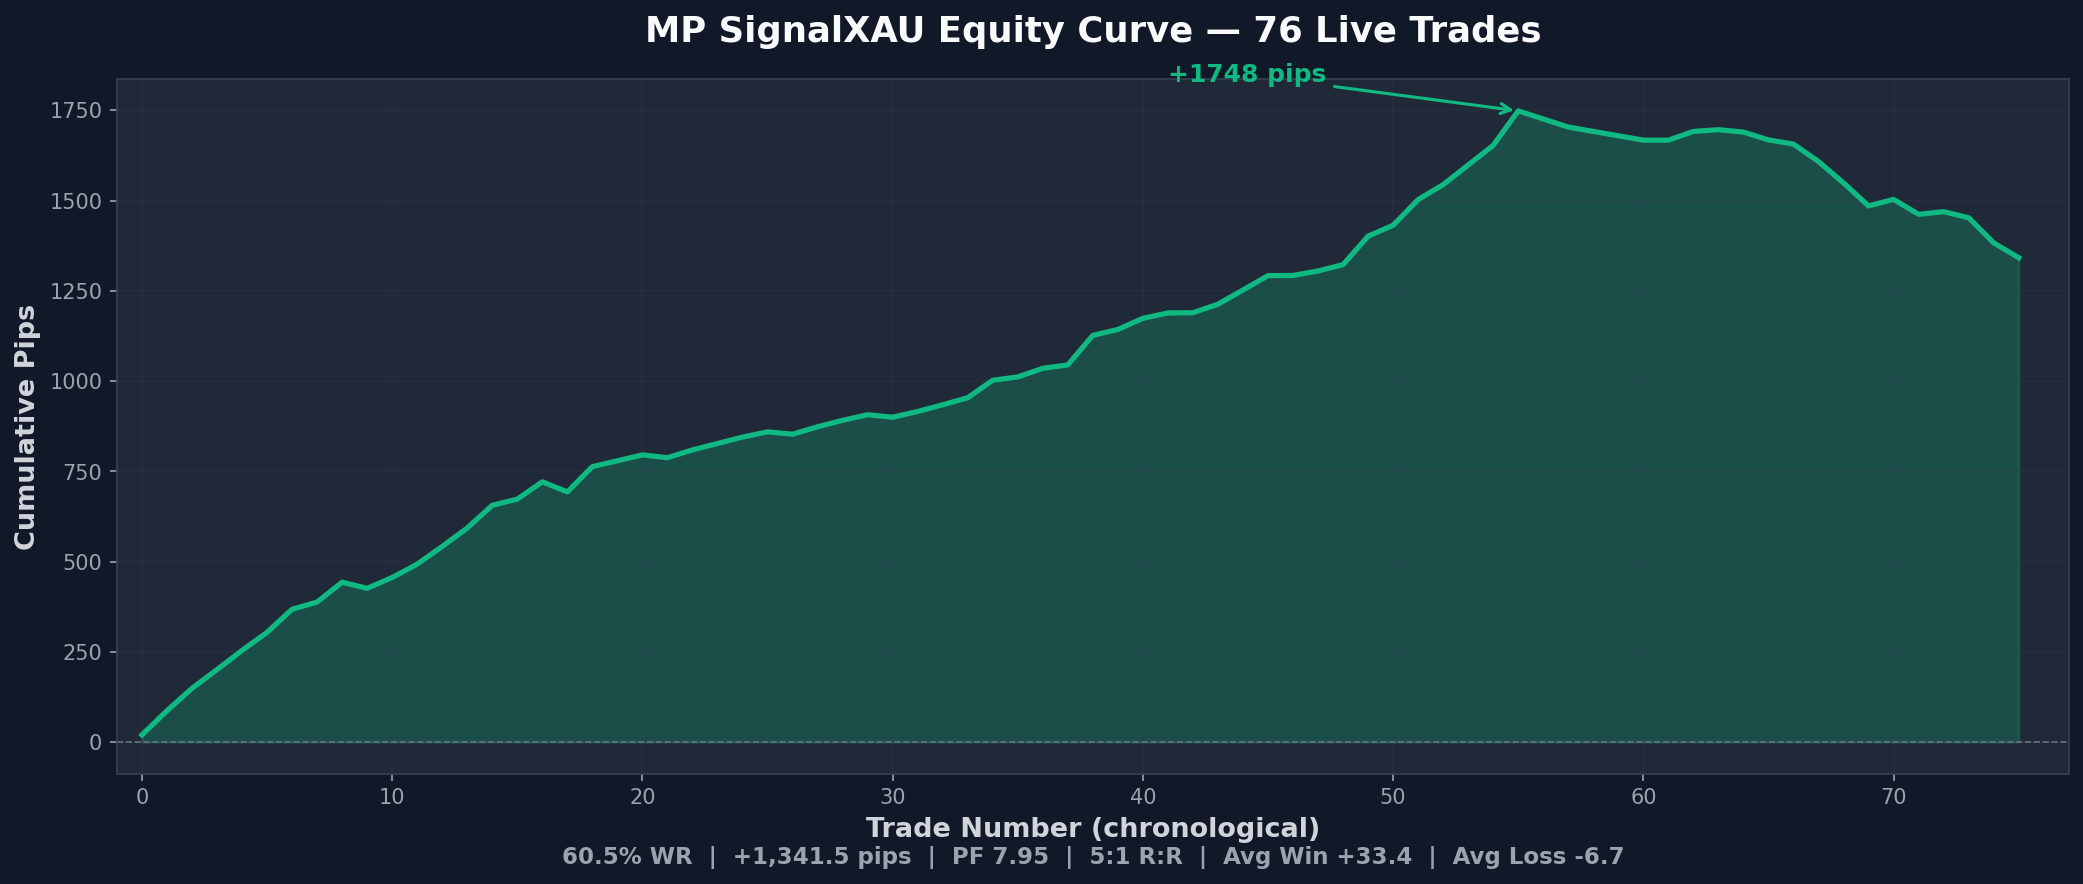
*76 live trades. +1,341.5 pips. Profit Factor 7.95. Not backtested — real execution.*
The summary:
- 76 trades | 46 wins | 29 losses | 1 pending
- Peak win rate: 87.5% (July 2026) — early sample was 60.5% across 76 trades
- Total pips: +1,341.5
- Profit factor: 7.95
- Longest win streak: 9 consecutive
- Longest loss streak: 8 consecutive
Notice that loss streak. 8 losses in a row. Even a system that wins 6 out of 10 trades produces stretches of 8 consecutive losers. The difference between the 6% and the 94% is what happens during those 8 losses. Do you start revenge trading? Do you double your size? Do you abandon the system?
Or do you trust the math and keep executing?
The 6% Playbook
After building and running this system, here's what actually works:
1. Score every single setup. Not all signals are created equal. My system generates a score from 0-100 for every potential trade. When the score is ≥90, the win rate jumps to 77.8%. When it's below 80, it drops to 56.9%. Knowing which trades to skip is worth more than knowing which ones to take.
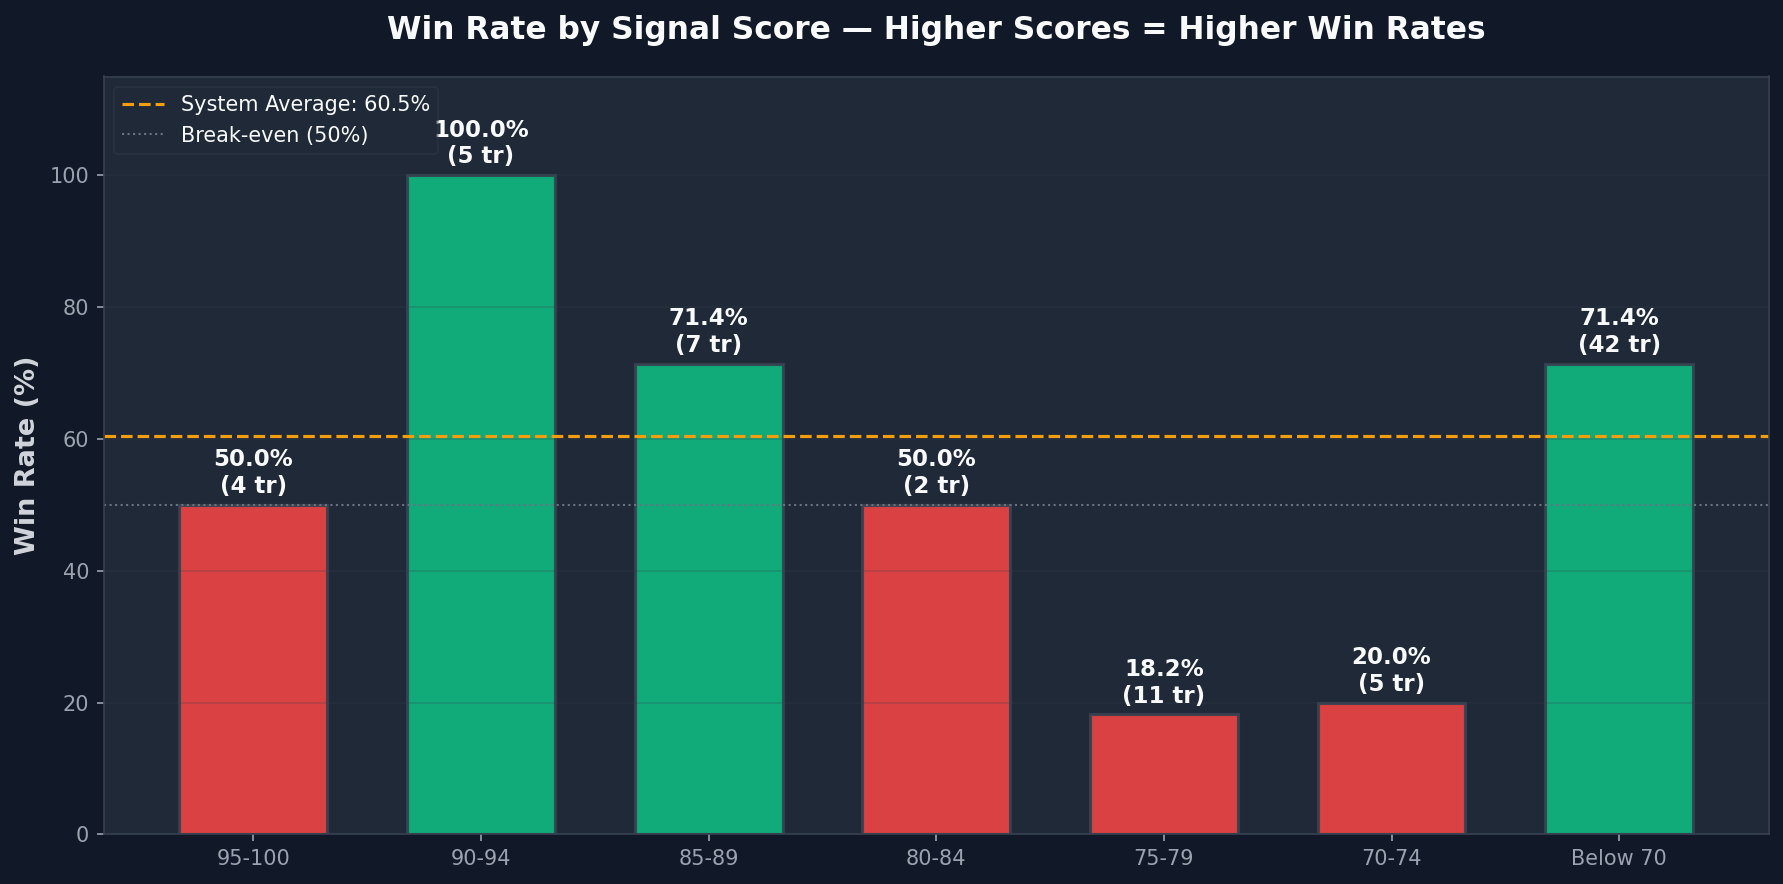
*Win rate by signal score. This is not a coincidence — proper scoring predicts outcomes.*
2. Shorts outperform longs in gold. My sell signals hit 67.6% win rate vs 54.8% for buys. Gold trends down faster and more efficiently than it trends up. Fear moves capital more decisively than greed. The 6% know when to favor one direction.
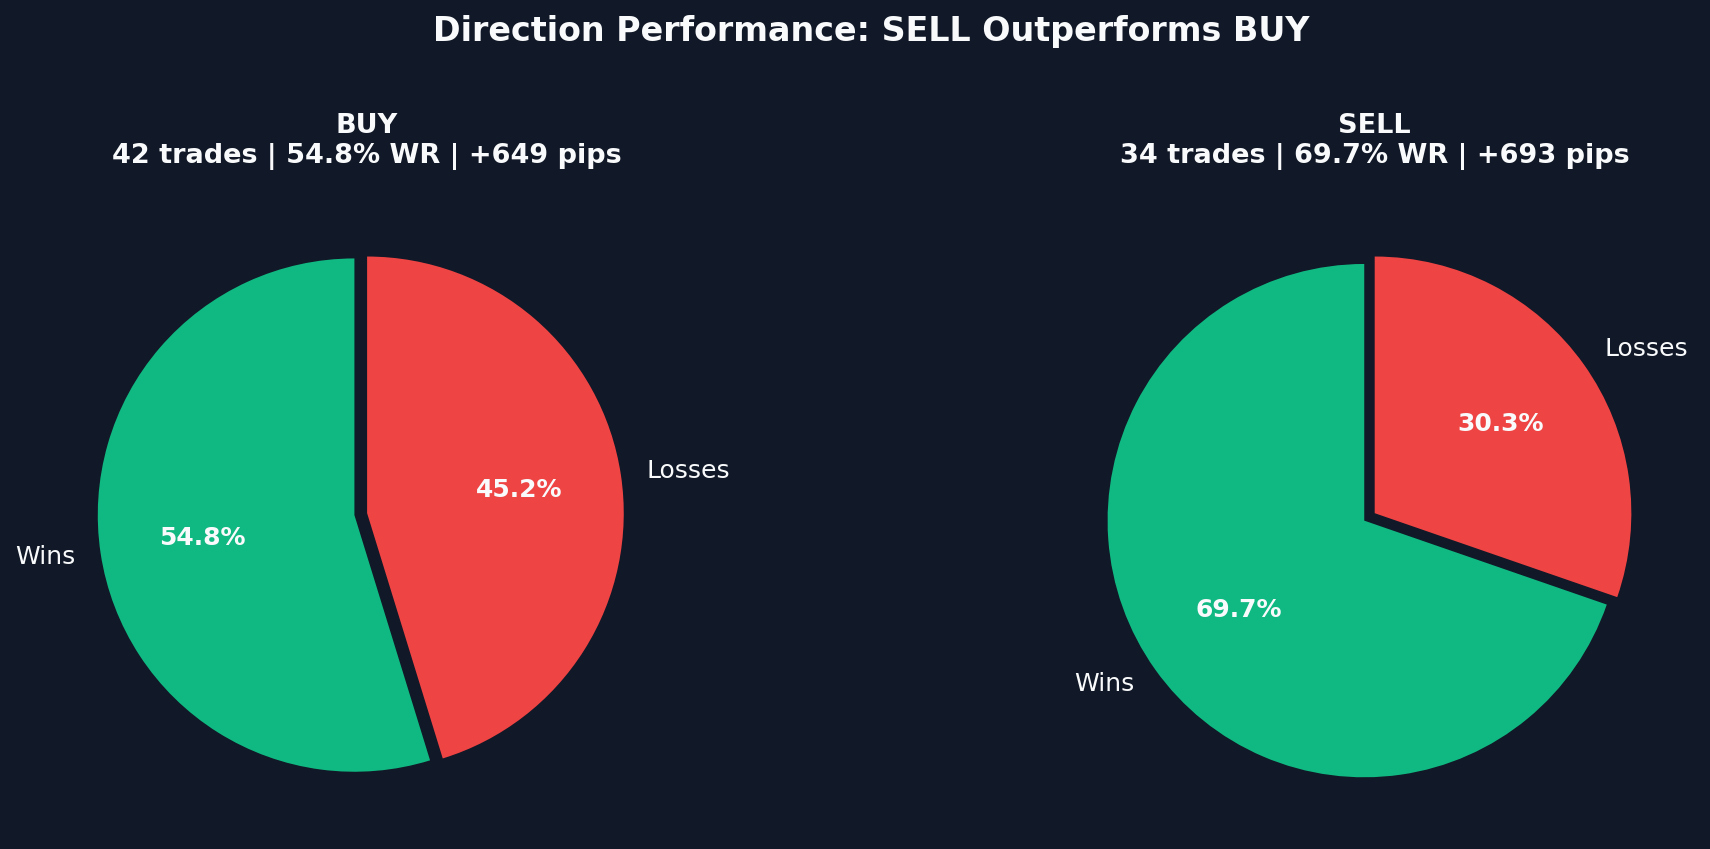
*Direction breakdown: SELL signals outperform BUY by 12.8 percentage points.*
3. Cut losses the moment structure invalidates. My average loss is -6.7 pips because the system doesn't wait for a fixed stop-loss to get hit. It exits the instant the structural reason for the trade disappears. Stop-losses are a last resort, not a strategy.
4. Ride winners until the market says stop. Winners run +33.4 pips on average because the system trails behind structural levels, not arbitrary take-profit targets. The market decides when the trade is over. The system just listens.
What The Architecture Looks Like
For those who want to see under the hood:
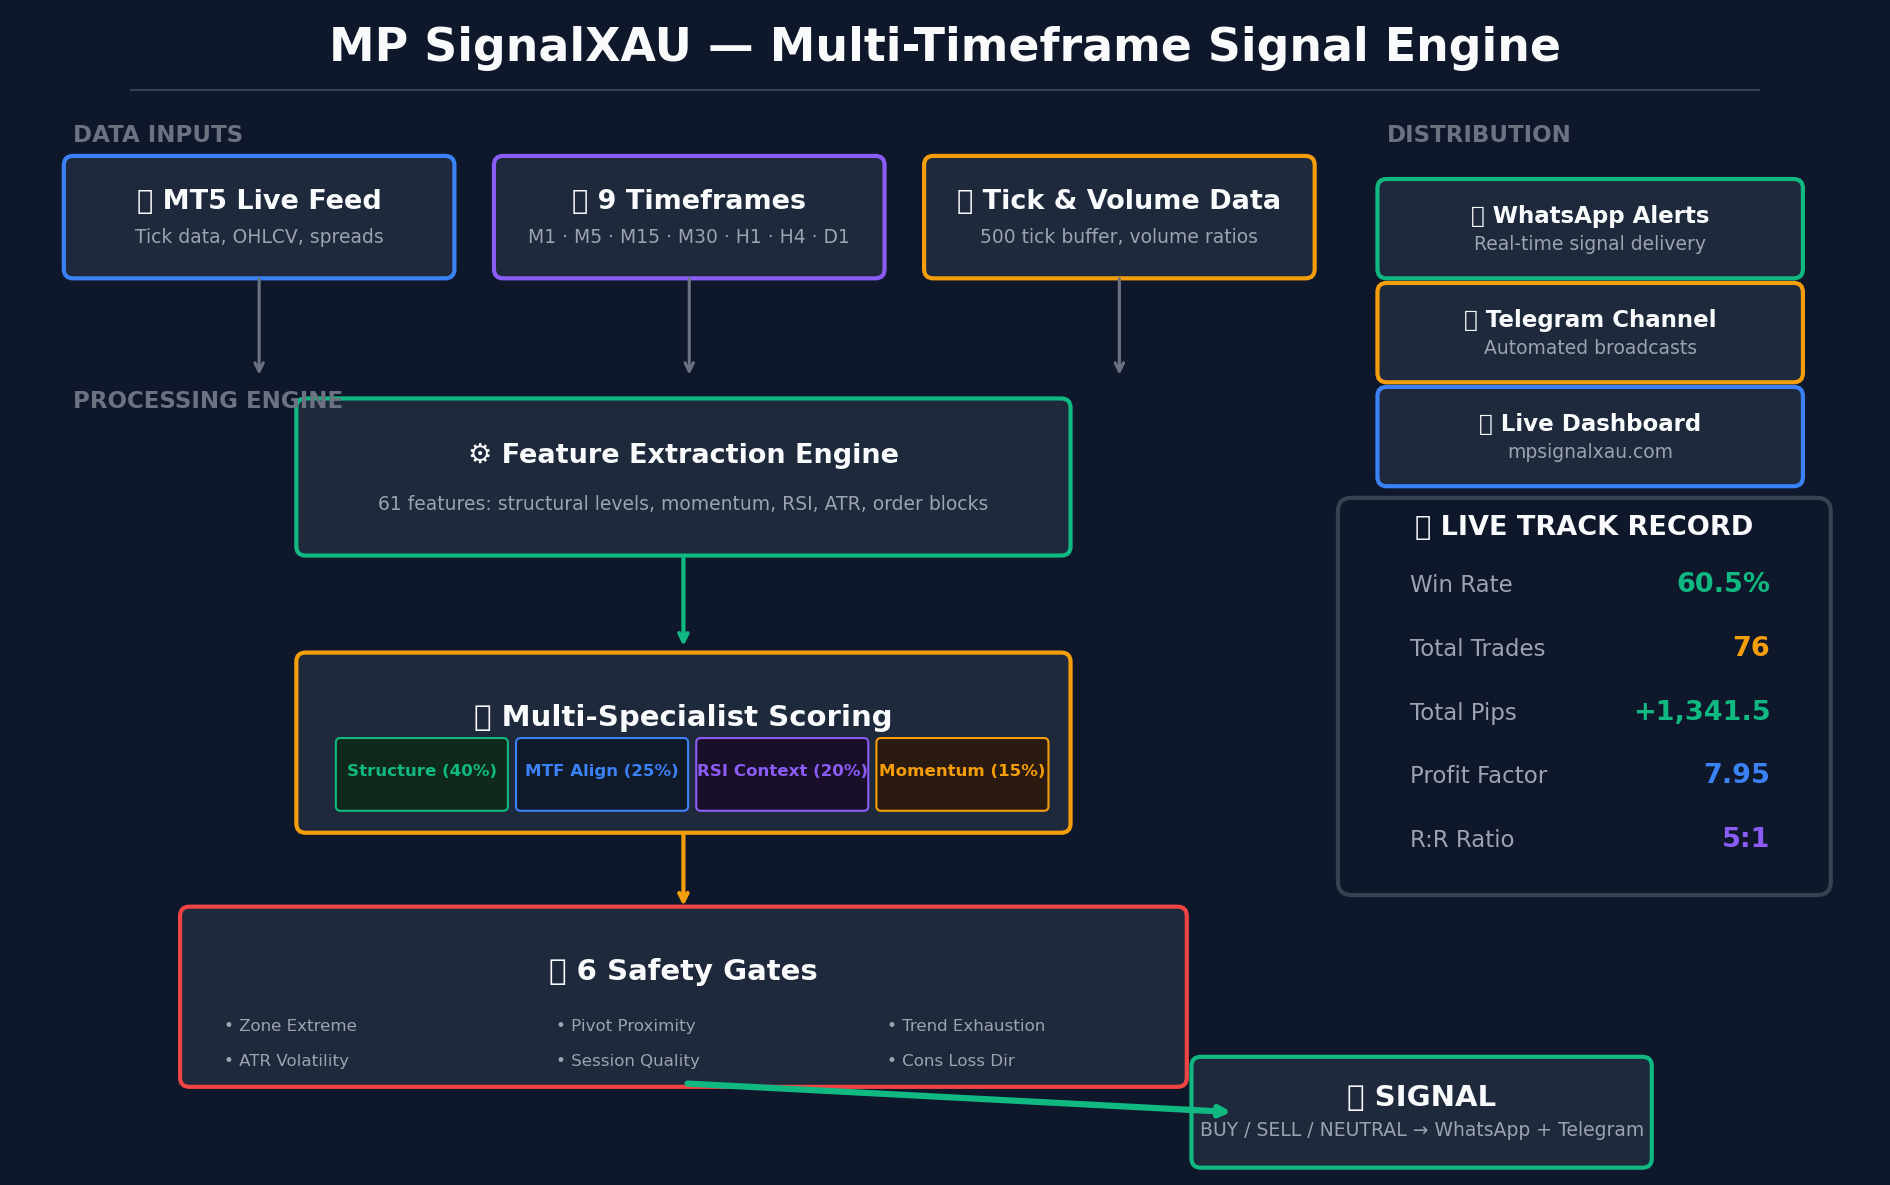
*The MP SignalXAU engine: 9 timeframes, 4 specialists, 6 safety gates, real-time distribution.*
This isn't a black box. It's a rules-based system that checks structural levels, multi-timeframe alignment, RSI context, and momentum across 9 timeframes — every 60 seconds. Six independent safety gates must pass before any signal is released. If any gate fails, the trade is blocked. No exceptions.
The Hard Truth
The market doesn't care about your analysis. It doesn't care how many hours you studied or how certain you feel. It doesn't care that your last three trades were winners or that you "deserve" this one.
It cares about one thing: where the liquidity is.
The 94% trade what they hope will happen. The 6% trade what the structure is actually doing.
Until you understand the difference, you know which side you're on.
—-
→ Live signals with structural analysis: [mpsignalxau.com](https://mpsignalxau.com)
→ Every trade, win or loss, published here: [mpsignalxau.com/performance.html](https://mpsignalxau.com/performance.html)
→ Free trial available. No credit card required.
*Trade what you see, not what you hope.*