There are days when gold rallies $40 for no apparent reason. No news. No data release. The chart pattern looks the same as it did yesterday. Your technical setup was perfect — and it still got destroyed.
Then there are days when gold drops $30 while your setup screamed "buy." The structure was there. The session timing was right. Everything checked out technically — but the market had other plans.
What changed? In most cases, it wasn't gold that changed. It was the dollar. Or bonds. Or equities. Gold doesn't trade in a vacuum — it's part of an interconnected web of global markets, and ignoring those relationships is like driving with one eye closed.
The DXY-Gold Relationship: The One That Matters Most
The U.S. Dollar Index (DXY) and XAUUSD have the strongest and most consistent inverse correlation in the gold trader's toolkit. The coefficient sits around -0.75 to -0.85 over weekly and monthly periods, making it the single most reliable intermarket signal.
Here's why: gold is priced in dollars. When the dollar strengthens against other currencies, it takes fewer dollars to buy the same amount of gold — so gold's dollar price falls. When the dollar weakens, gold's dollar price rises.
But the relationship isn't mechanical. It's behavioral. Here's what actually happens:
When the dollar strengthens, it's usually because of two things: rising U.S. interest rates (making dollar-denominated assets more attractive) or global risk aversion (causing a flight to dollar safety). Both scenarios are bearish for gold in dollar terms — higher rates make non-yielding gold less attractive, and risk aversion drives capital into Treasury bonds instead of gold.
When the dollar weakens — typically during periods of low U.S. rates or global risk appetite — gold rallies. Investors seek alternatives to depreciating dollars, and gold is the oldest alternative in the book.
The practical rule: never trade gold against the dollar's direction on the daily timeframe. If DXY is in a confirmed uptrend on D1, your XAUUSD longs are fighting the tide. If DXY is breaking down on D1, your XAUUSD shorts are swimming upstream.
Treasury Yields: The Opportunity Cost of Holding Gold
Gold pays no interest. No dividend. No yield. When you hold gold, you're giving up the return you could earn holding a 10-year Treasury bond instead.
When the 10-year yield rises, gold becomes relatively less attractive — the opportunity cost of holding it increases. When yields fall, gold becomes more attractive — the gap between "earning something" and "earning nothing" shrinks.
The correlation between the 10-year Treasury yield and XAUUSD is approximately -0.60 to -0.70. That's strong enough to matter, but not strong enough to trade blindly.
The real power of monitoring yields comes from divergences. When gold is rallying despite rising yields, something significant is happening — usually a geopolitical event or a flight to safety that's overriding the normal yield relationship. When gold is falling despite falling yields, it's often a signal that a broader liquidation is underway — investors selling everything, including gold, to meet margin calls or raise cash.
The most actionable setup: when the 10-year yield tests a key level (like 4.5% or 4.0%), watch gold for a corresponding test. If yields break through resistance and gold doesn't break support, the divergence is a powerful bullish signal for gold.
The S&P 500 Connection: Risk-On vs Risk-Off
Gold's relationship with equities is more complex than most traders realize.
In normal conditions, gold and the S&P 500 have a mild negative correlation — around -0.20 to -0.30. When stocks rally, gold often drifts lower as capital flows toward higher-yielding risk assets.
But during crises, the correlation can flip. In March 2020, gold initially dropped alongside stocks — a liquidity panic where everything was sold. Then gold rallied sharply while stocks continued falling — the classic flight-to-safety trade. Then both rallied together as central bank liquidity flooded the system.
The lesson: the gold-equity relationship is conditional, not constant. In a risk-on environment, gold typically underperforms. In a risk-off environment, gold can either crash (liquidity crisis) or rally (flight to safety). The difference depends on whether the crisis is about solvency (bearish for gold initially) or confidence in fiat currency (bullish for gold).
The practical rule: don't use the S&P 500 as a primary gold signal. Use it as context. If stocks are crashing and gold is holding steady, that's remarkable strength — and often precedes a major gold rally.
Real Yields: The Variable That Ties It All Together
If you only monitor one macro variable for gold, make it real yields — the 10-year Treasury yield minus inflation expectations.
Real yields represent the actual return you earn after inflation. When real yields are positive (you earn more than inflation), gold struggles — why hold a zero-yield asset when you can earn a real return elsewhere? When real yields are negative (inflation exceeds yields), gold thrives — holding a zero-yield asset is better than guaranteed purchasing power loss.
This is why gold rallied dramatically in 2020-2021. Real yields plunged deep into negative territory as the Fed held rates at zero while inflation surged past 5%. The math was brutal: a -4% real yield meant holding Treasuries guaranteed a 4% annual loss in purchasing power. Gold, at zero nominal yield but zero guaranteed loss, became the preferred store of value.
Monitoring real yields gives you the macro backdrop. When real yields are trending lower, be biased long gold. When real yields are trending higher, be cautious — the macro tide is against you regardless of what your charts say.
The 5-Minute Pre-Market Checklist
Every trading session, before looking at a single XAUUSD chart, check these five things:
DXY (Daily): What's the trend on D1? Is the dollar strengthening or weakening? If DXY is above its 20-day moving average with upward momentum, your gold longs need extra confirmation. Below the 20MA with downward momentum, your gold shorts are fighting the current.
10-Year Yield: Has the yield made a significant move overnight? A 10+ basis point move in yields will drive a corresponding gold move. Know whether the yield backdrop is supportive or hostile.
S&P 500 Futures: Is the equity market in risk-on or risk-off mode? A 1%+ gap in S&P futures changes the gold correlation dynamics for the entire session.
Real Yields (TIPS): Check the 10-year TIPS yield. Is it moving with or against nominal yields? A divergence between nominal and real yields is often a leading indicator for gold.
Economic Calendar: Any high-impact data releases today? NFP, CPI, FOMC minutes, and GDP can override every intermarket relationship for 30-60 minutes after release. Know the schedule before you trade.
This checklist takes five minutes. It won't give you entries. It won't tell you where to place your stop. But it will tell you which side of the market has the macro wind at its back — and that information alone will save you from fighting losing battles.
How MP Signal Uses Intermarket Data
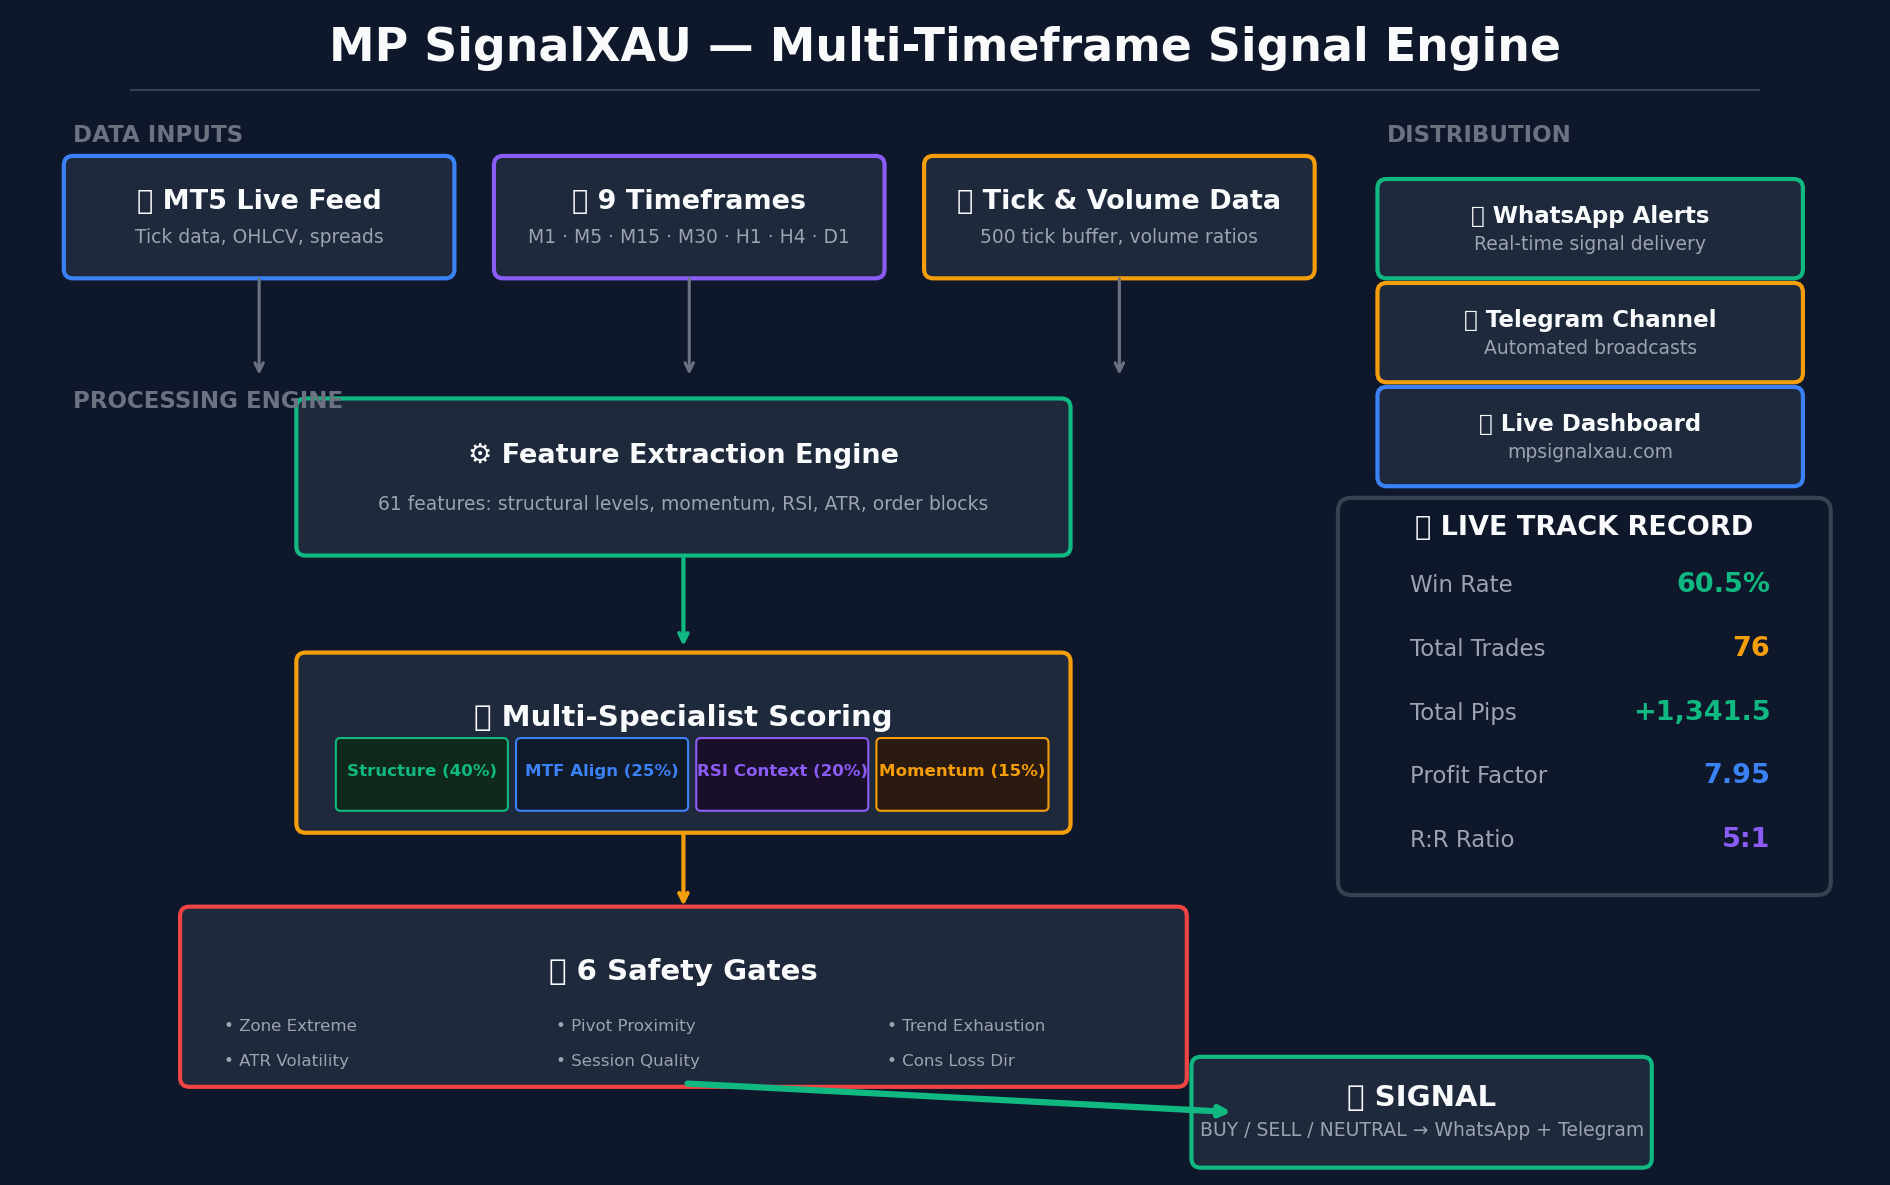
The MP Gate system includes a correlation module that monitors DXY, yields, and equity futures in real time. It doesn't use this data to generate signals — the signals come from the 9-timeframe XAUUSD scanner. Instead, it uses intermarket data to adjust signal scoring.
A buy signal that triggers while DXY is breaking down on H4 gets a score bonus. The same signal while DXY is surging gets a penalty. Not a kill switch — the signal can still fire — but it needs to be stronger to overcome the macro headwind.
This is the practical application of intermarket analysis: not as a standalone strategy, but as a filter that tilts the odds in your favor. A 72% probability setup with macro alignment becomes a 78% trade. A 72% setup against the macro backdrop becomes a 65% trade. The difference compounds over hundreds of trades.
The Bottom Line
Gold doesn't trade in isolation. Every XAUUSD move exists within a context of dollar flows, yield differentials, equity sentiment, and real return expectations. The traders who ignore this context are the ones who get blindsided by $40 moves "for no reason."
The traders who check their pre-market macro list before every session? They saw it coming.
Know what's moving gold before you trade gold.