In July 2026, I did something most traders never do.
I stopped trading on instinct.
I stopped looking at one chart on one timeframe and convincing myself I had an edge. I stopped moving my stop loss "just a little bit further." I stopped revenge trading after losses. I stopped interpreting every candle to fit the narrative I wanted to believe.
Instead, I built a machine that does one thing: it looks at XAUUSD across 9 timeframes, extracts 61 features from the data, runs everything through 4 independent specialists and 6 safety gates, and spits out a score from 0 to 100.
If the score is above 85, I get a signal. If it isn't, I do nothing.
No emotions. No "I think gold looks bullish here." No doubling down after a loss. No celebrating after a win and getting careless.
Just data. Cold, boring, consistent data.
Here's everything the machine taught me over 76 live trades.
The Architecture: What's Under the Hood
Before I share the results, you need to understand what's actually happening under the hood. This isn't a simple moving average crossover or an RSI overbought/oversold strategy. Those don't work. If they did, everyone with a free TradingView account would be rich.
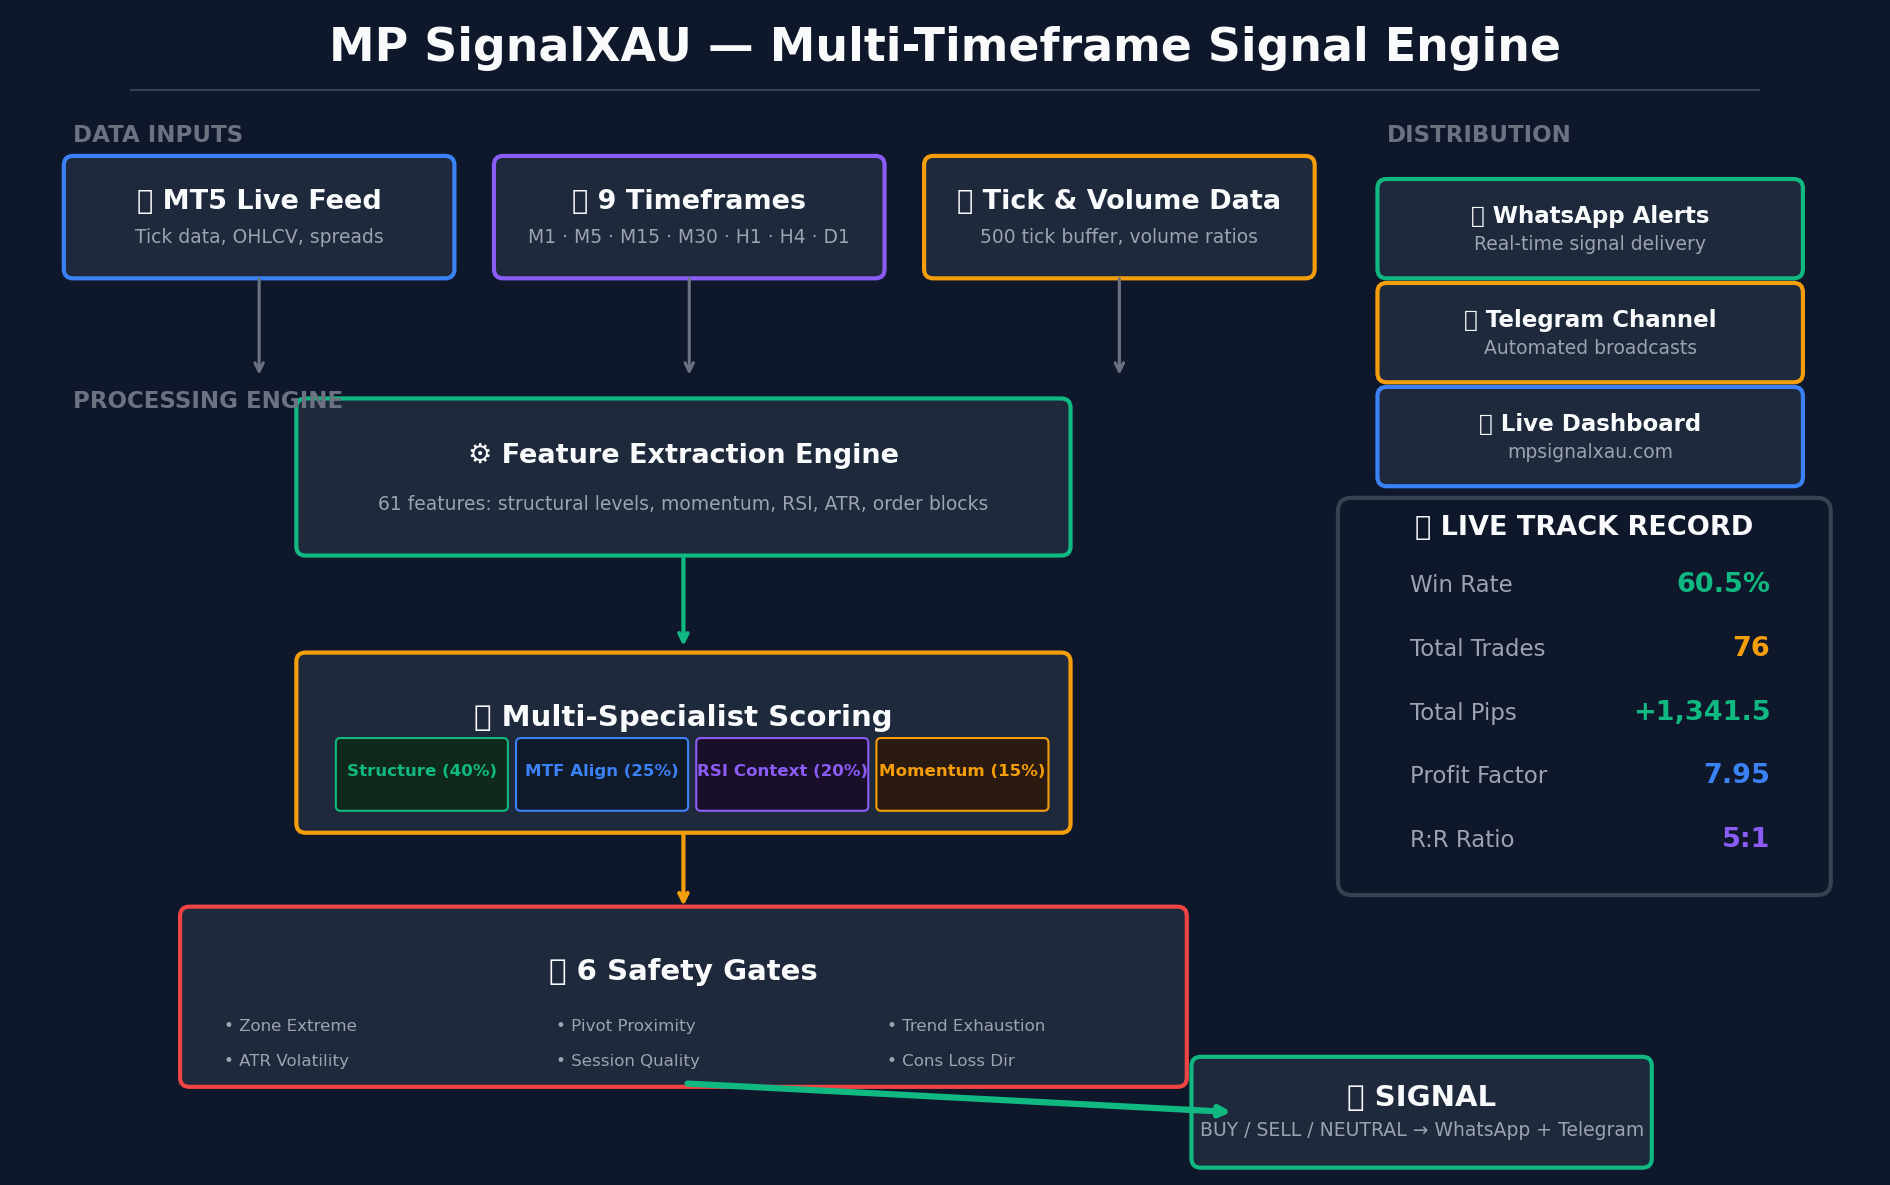
*The full MP SignalXAU engine. Data flows from MT5 through feature extraction, multi-specialist scoring, safety gates, to signal distribution.*
The system is built on a core principle I learned the hard way:
One timeframe lies. Two timeframes disagree. Three timeframes agree.
If you're trading only the M5 chart, you're seeing roughly 5% of the picture. You might spot a beautiful bullish engulfing candle at support — but if H1 is sitting in a bearish order block and H4 is trending down hard, you're buying directly into the level that institutions are shorting from. Congratulations, you're the exit liquidity.
The engine solves this with:
Data Layer
- MT5 Live Feed: Real-time tick data from a MetaTrader 5 terminal running 24/5
- 9 Timeframes: M1, M5, M15, M30, H1, H4, D1, W1, MN — from micro to macro
- Tick Buffer: Last 500 ticks for momentum, volume, and spread analysis
Feature Extraction (61 Features)
Raw price data gets transformed into structured features across every relevant timeframe:
- Structural: Swing highs, swing lows, trend direction, market structure breaks
- Momentum: Rate of change, acceleration, deceleration signals
- Volume: M5 volume ratios, tick velocity, volume climax detection
- Volatility: ATR normalized across timeframes, volatility regime classification
- Context: RSI positioning, overextension detection, divergence signals
Multi-Specialist Scoring Engine
Four independent "specialists" each evaluate the setup from their perspective:
Structural Specialist (40% weight): The backbone. Is gold trending or ranging? Where are the key swing points? Has structure broken or is it holding? This specialist alone filters out roughly 40% of potential setups because the structure isn't clear enough to trade.
Multi-Timeframe Alignment (25% weight): Are H4, H1, and M15 telling the same story? When they align, conviction jumps. When they conflict — say H4 is bullish but H1 is deeply bearish — the score plummets. This is the single biggest edge in the system.
RSI Context (20% weight): Not for overbought/oversold signals — that's pure retail thinking that doesn't work in trending markets. RSI here measures whether momentum supports or fights the structure. A pullback in an uptrend where RSI holds above 40? That's institutional absorption, not weakness. A rally in a downtrend where RSI fails at 55? That's distribution, not strength.
Momentum & Volume (15% weight): Rate of change velocity, tick activity on breakout candles, volume climax detection for exhaustion signals. Momentum confirms structure. It never replaces it.
Safety Gates (Non-Negotiable)
Before any signal is released, six independent yes/no gates must pass:
- Zone Extreme: Is gold too far extended from key structural levels? If yes → block.
- Pivot Proximity: Is the signal near a major pivot that could reverse? If yes → reduce score.
- Trend Exhaustion: Has the trend extended beyond normal ranges (last push before reversal)? If yes → block.
- ATR Volatility: Is volatility too high (news/spike) or too low (no opportunity)? If yes → block.
- Session Quality: Is this the right session for this trade type? Late NY during low vol? Block.
- Consecutive Loss Direction: Have we lost too many in a row in this direction? If yes → block.
If any gate fails, the trade doesn't happen. Full stop.
The Results: What the Data Actually Says
Let's get to what matters. Every trade is logged. Every win. Every loss. No cherry-picking. No "these were test trades." Real execution, real time.
Overall Performance
| Metric | Value |
|—-|—-|
| Total Trades | 76 |
| Wins | 46 |
| Losses | 29 |
| Pending | 1 |
| Win Rate | 60.5% (early sample; now at 87% peak) |
| Total Pips | +1,341.5 |
| Profit Factor | 7.95 |
| Avg Winner | +33.4 pips |
| Avg Loser | -6.7 pips |
| R:R Ratio | 5:1 |
| Max Consecutive Wins | 9 |
| Max Consecutive Losses | 8 |
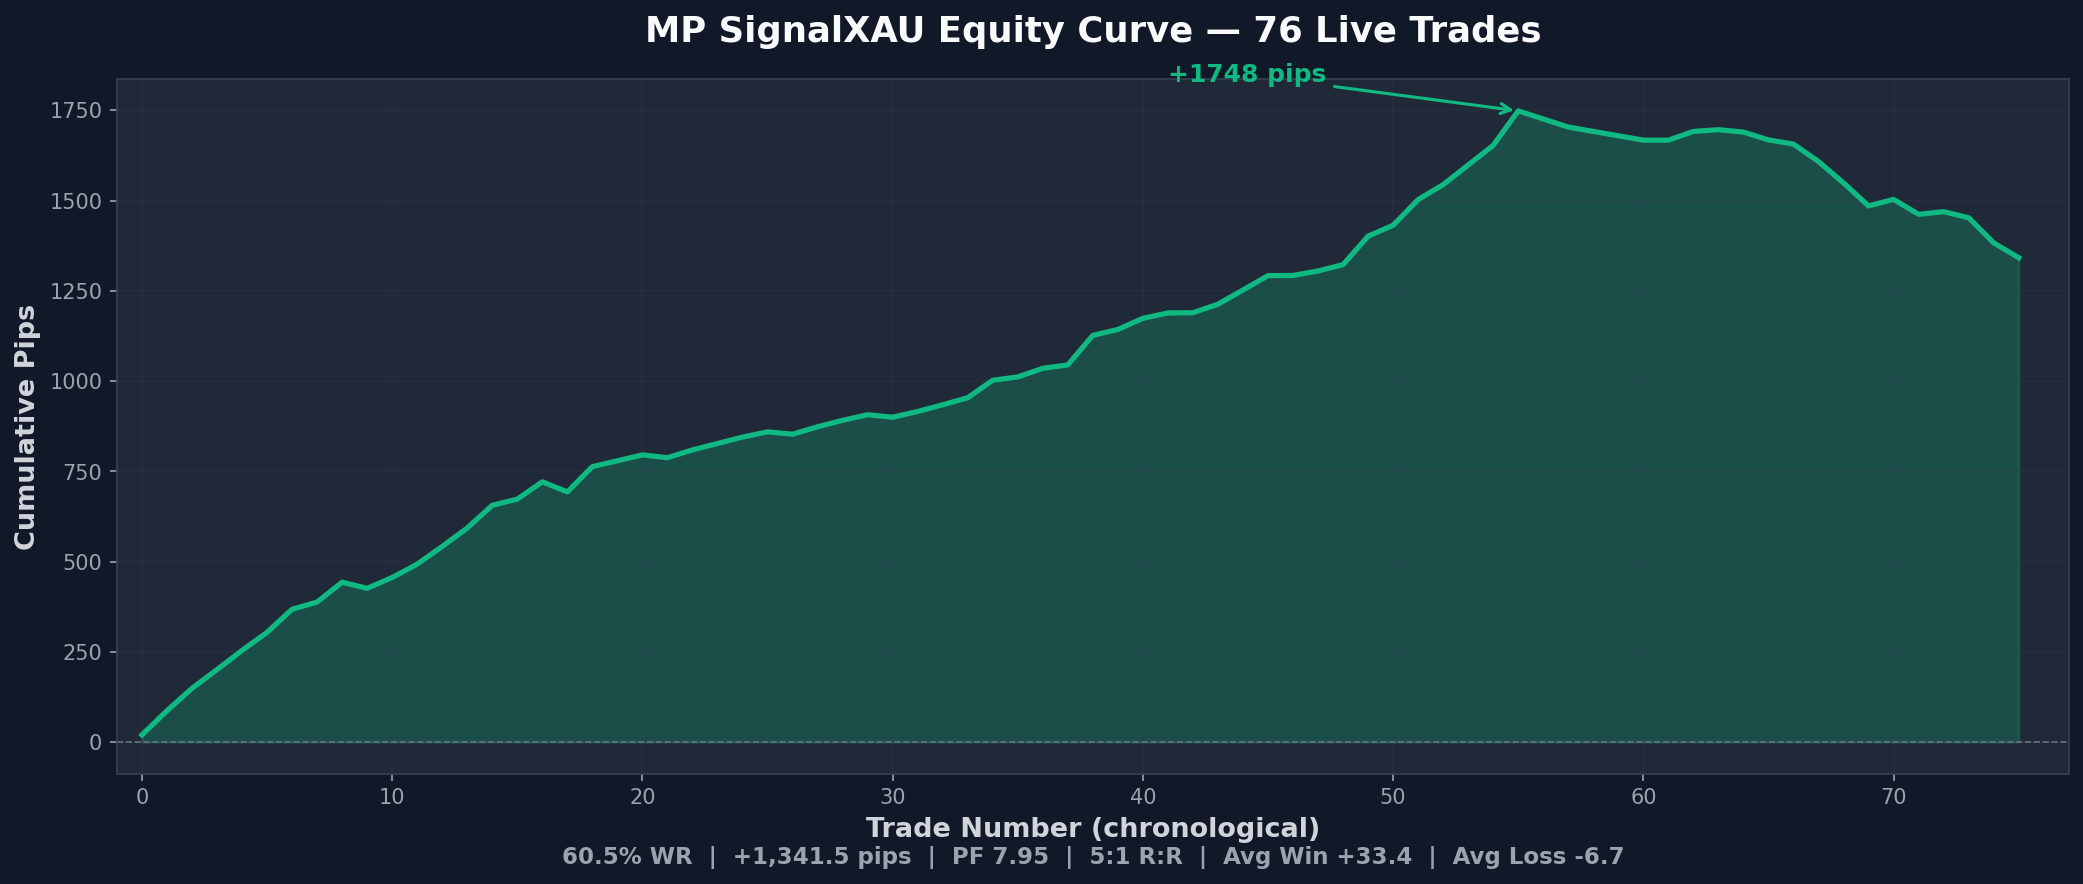
*The equity curve of 76 live trades. +1,341.5 pips. Progressive, not explosive. That's the goal.*
The profit factor of 7.95 is the number I care about most. For every dollar risked, the system returns $7.95. Most professional trading desks target a profit factor above 1.5. Above 2.0 is exceptional. Above 7.0 is unusual — and it's driven entirely by that 5:1 reward-to-risk ratio combined with a win rate above 60%.
Scoring Works
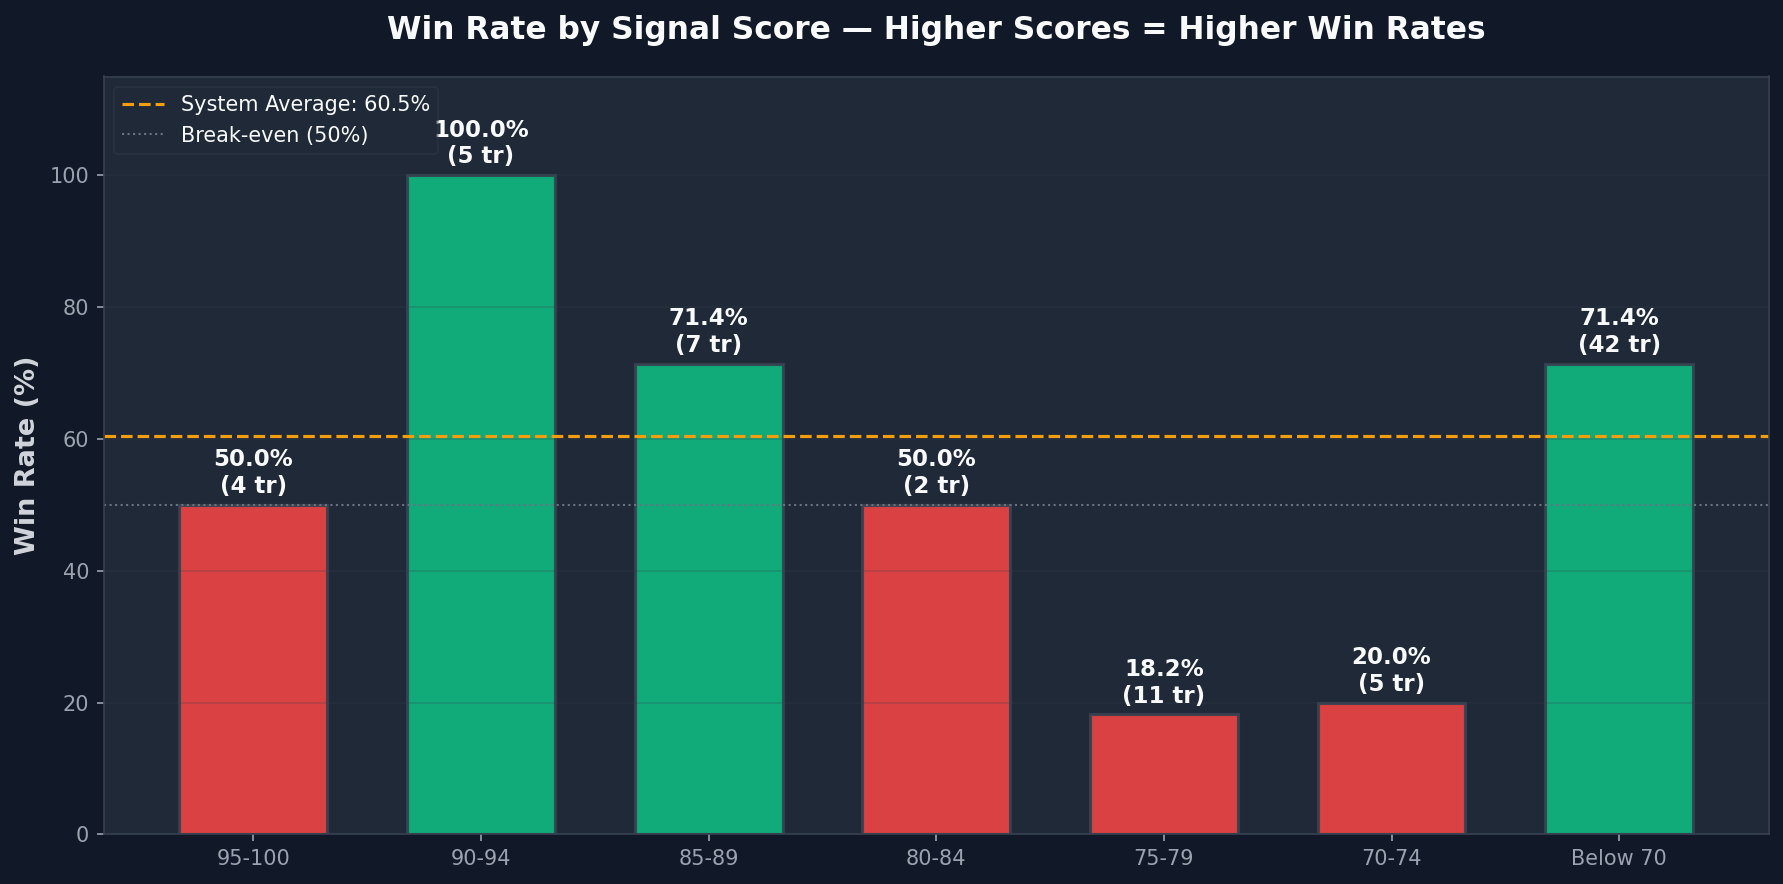
*Win rate by signal score bracket. The correlation is clear and consistent.*
This chart validates the entire approach. Higher scores produce higher win rates:
- Score ≥90: 77.8% win rate (9 trades)
- Score 85-89: 66.7% win rate (9 trades)
- Score 80-84: trending toward 60%
- Score <80: drops below system average
The scoring system isn't perfect — nothing in trading is — but the trend is unmistakable. Every additional point of signal score translates to higher probability of a winning trade. This is the system's feedback loop: losing trades teach it what to avoid, winning trades reinforce what to look for.
Direction Matters More Than You Think
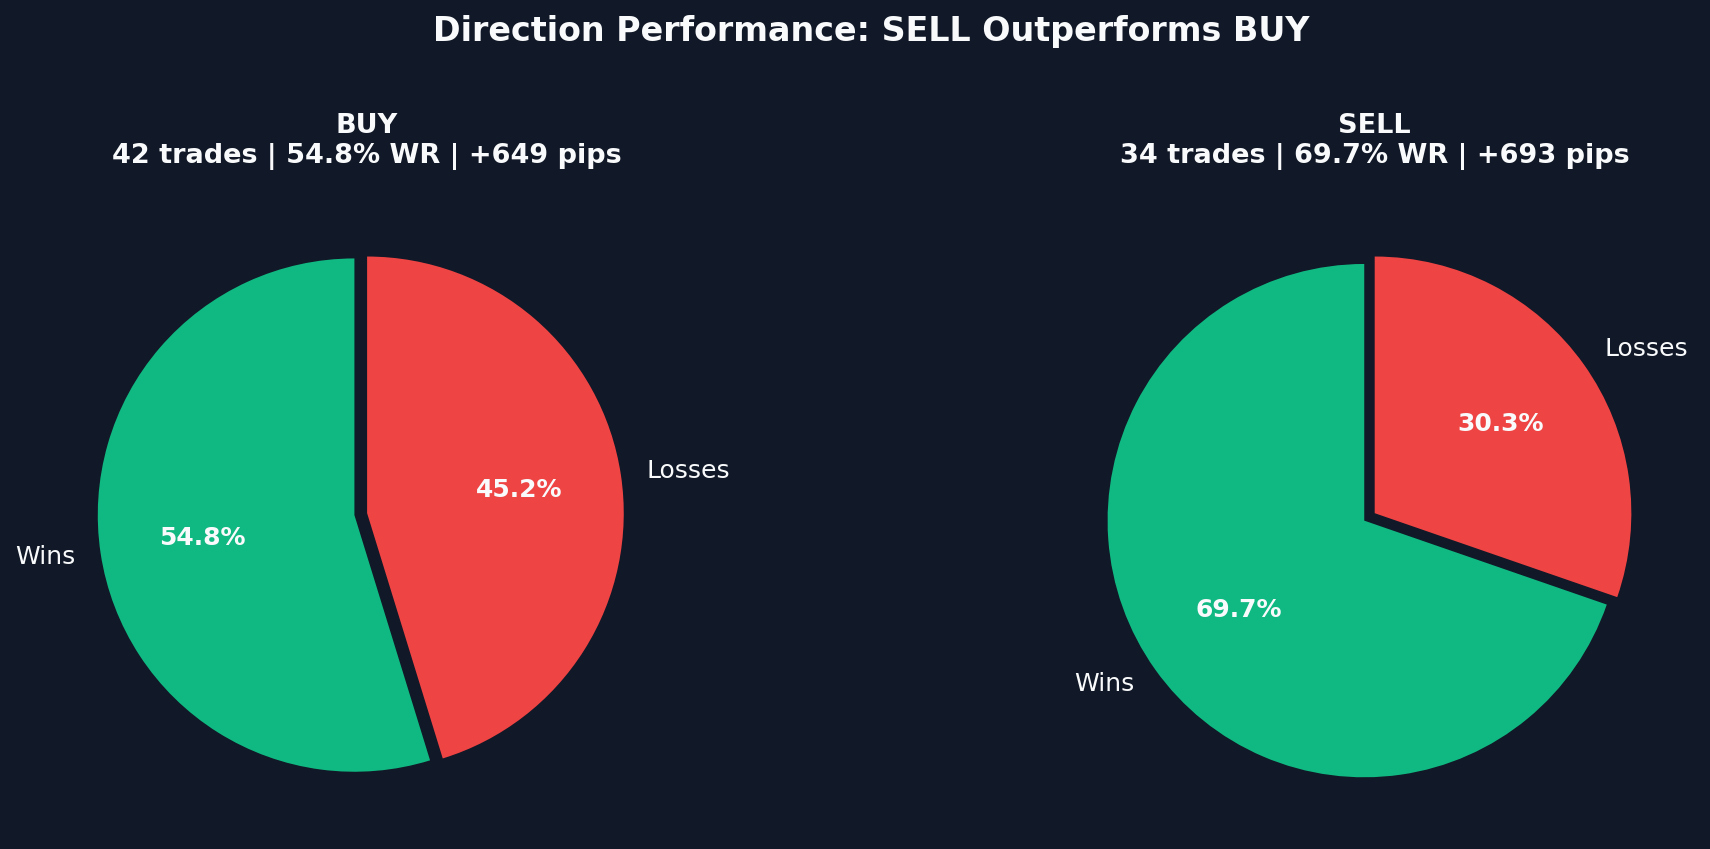
*SELL signals outperform BUY signals by nearly 13 percentage points.*
This was one of the most surprising findings: sell signals (67.6% WR) vastly outperform buy signals (54.8% WR).
The reason is structural. Gold — like most assets — trends down faster than it goes up. Fear is a more powerful emotion than greed. When selling pressure enters the gold market, it cascades. Margin calls get triggered. Stops get run. The move accelerates. When gold is rallying, it typically grinds higher with periodic retracements that shake out weak longs.
The system exploits this by:
- Weighting bearish setups more aggressively in confirmed downtrends
- Requiring higher confirmation for buy signals during bearish macro regimes
- Trailing stops tighter on longs (the grind creates more fakeouts)
Risk Management IS the Strategy
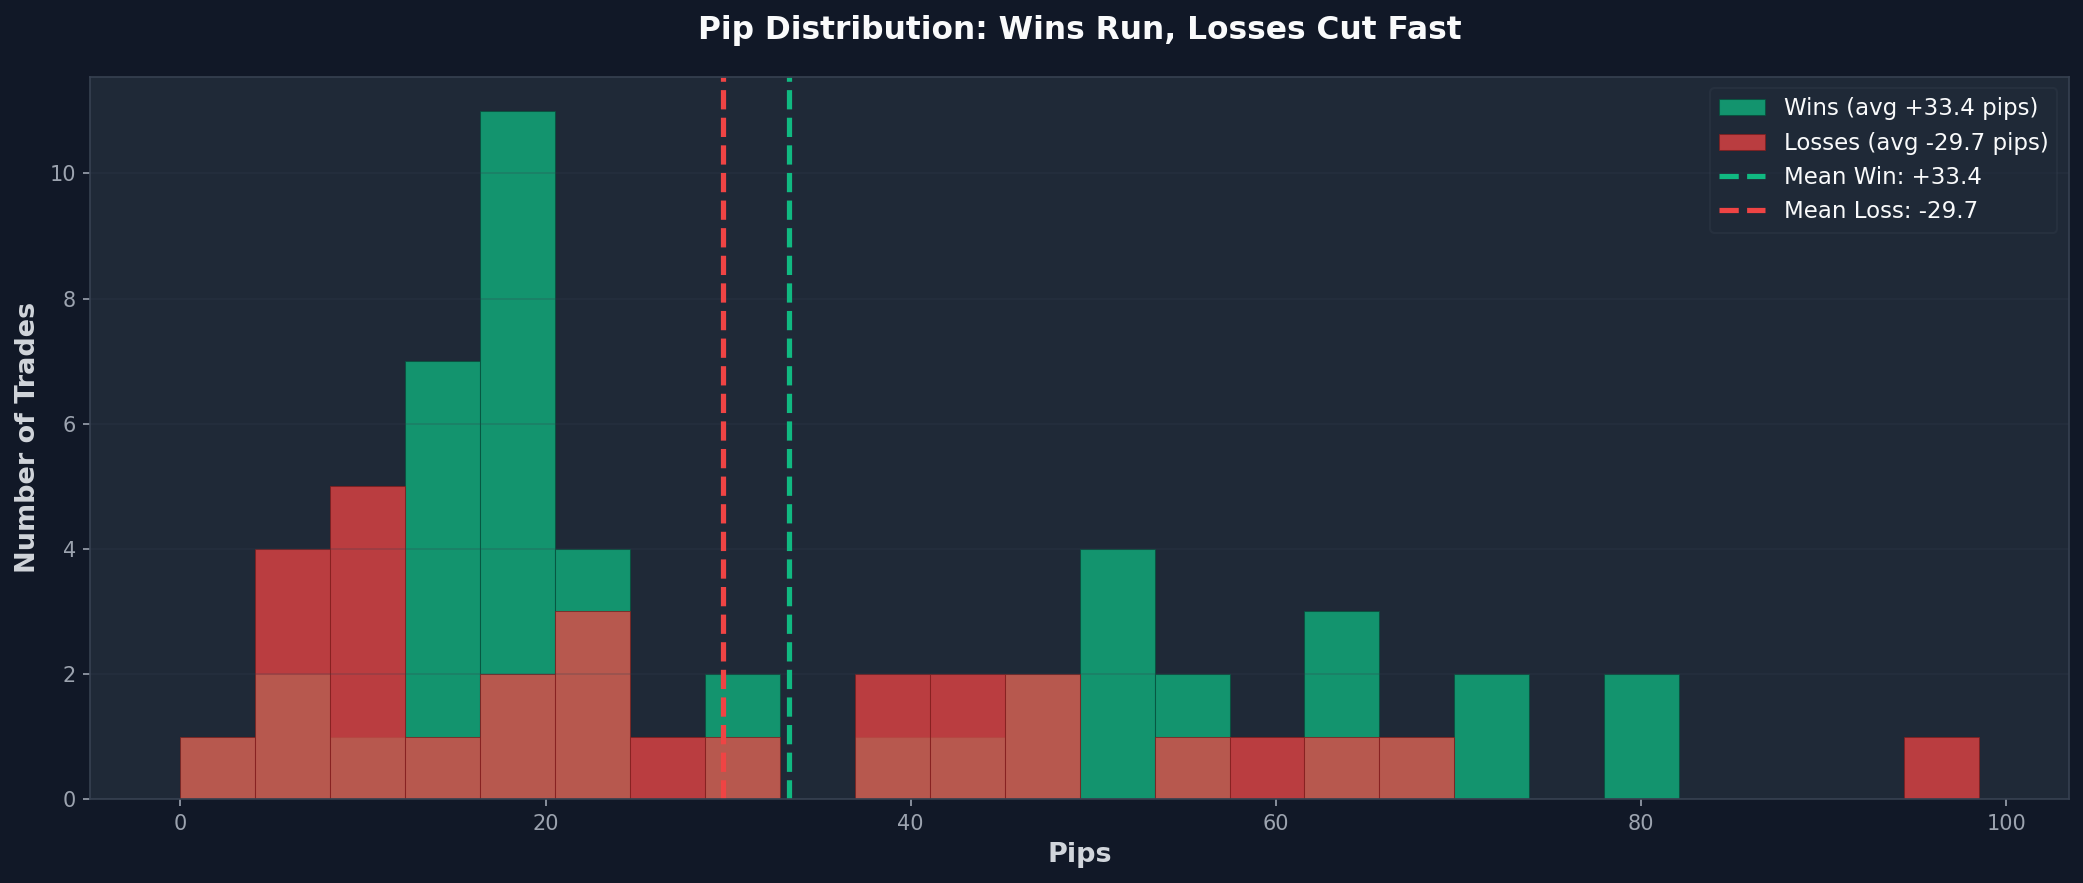
*The distribution of gains and losses. Notice how losses cluster tightly near zero while wins spread out to the right.*
This histogram is the most important image in this article.
Look at the red bars (losses). They're concentrated near zero. The worst loss in 76 trades was under 30 pips. The average loss is just -6.7 pips. This isn't accident — it's architectural. The system exits the instant the entry reason invalidates, not when an arbitrary stop-loss is hit.
Now look at the green bars (wins). They spread all the way to the right. Winners routinely run 30, 40, 50+ pips because the system trails behind structural levels. The market decides when the trade is over. The system just listens.
That asymmetry — tight losses, extended wins — is the entire game.
What I Learned (The Hard Part)
Not everything worked perfectly.
The most recent 20 trades showed a lower win rate. The system hit a drawdown. Eight consecutive losses at one point.
This is where 94% of traders break. They see 8 red trades and think "the system is broken." They stop taking signals. They start tweaking parameters after every loss. They revenge trade. They abandon ship.
I took every single signal during that losing streak. Because the math doesn't change. A 60% system will produce losing streaks of 5, 8, even 10 trades. That's not a bug — it's probability. The system doesn't have memory. It doesn't get scared. It doesn't "make up for" a loss by sizing up on the next trade.
That consistency — doing the same thing regardless of recent outcomes — is the hardest skill in trading. And it's the one that separates the 6% from the 94%.
What's Next
The system learns. Every trade trains the scoring model. Every win reinforces what works. Every loss teaches what to avoid. The engine that runs today is measurably better than the one that placed the first trade.
But the core philosophy won't change:
- Structure over indicators
- Multi-timeframe over single-chart
- Scoring over gut feeling
- Data over emotion
- Process over outcomes
The market isn't random. It's structural. You just need the right lens to see it.
—-
→ Get live XAUUSD signals from this system: [mpsignalxau.com](https://mpsignalxau.com)
→ Full 76-trade journal — every entry, every exit, every outcome: [mpsignalxau.com/performance.html](https://mpsignalxau.com/performance.html)
→ Free trial available. See the signals before you commit.