The System: OMNI v10
Before we cut it open, here's what was under the hood.
OMNI v10 is a multi-specialist ensemble engine. Instead of one strategy making a binary BUY/SELL call, it runs eight independent analysis modules — each a specialist in one dimension of market behavior:
- Trend Specialist — H4/H1 directional bias using EMA structure and higher-high/lower-low sequencing
- Momentum Specialist — Rate of change, volume confirmation, impulse detection
- Reversion Specialist — Mean reversion probability, RSI extremes, compression zones
- Breakout Specialist — Key level breaks, range expansions, volatility regime shifts
- Order Flow Specialist — Tick velocity, absorption patterns, delta divergence
- Volatility Specialist — ATR compression/expansion, regime detection
- Correlation Specialist — DXY divergence, bond yield alignment
- Pattern Specialist — Candlestick formations, CHoCH (Change of Character) detection
Each specialist votes. The votes are weighted and combined into a v10 confidence score (0–100%). A separate v5 gate score (0–10) runs parallel checks: zone validity, pivot proximity, trend exhaustion, ATR volatility, and session quality.
For a signal to fire, BOTH must agree: v5 ≥ 7 AND v10 ≥ 70% AND same direction.
On paper, this architecture is sound. Multi-dimensional. Redundant. Hard to fool.
In production, it ran a 28.6% win rate.
The Cold Numbers
Here are the trades, no filter, no cherry-picking:
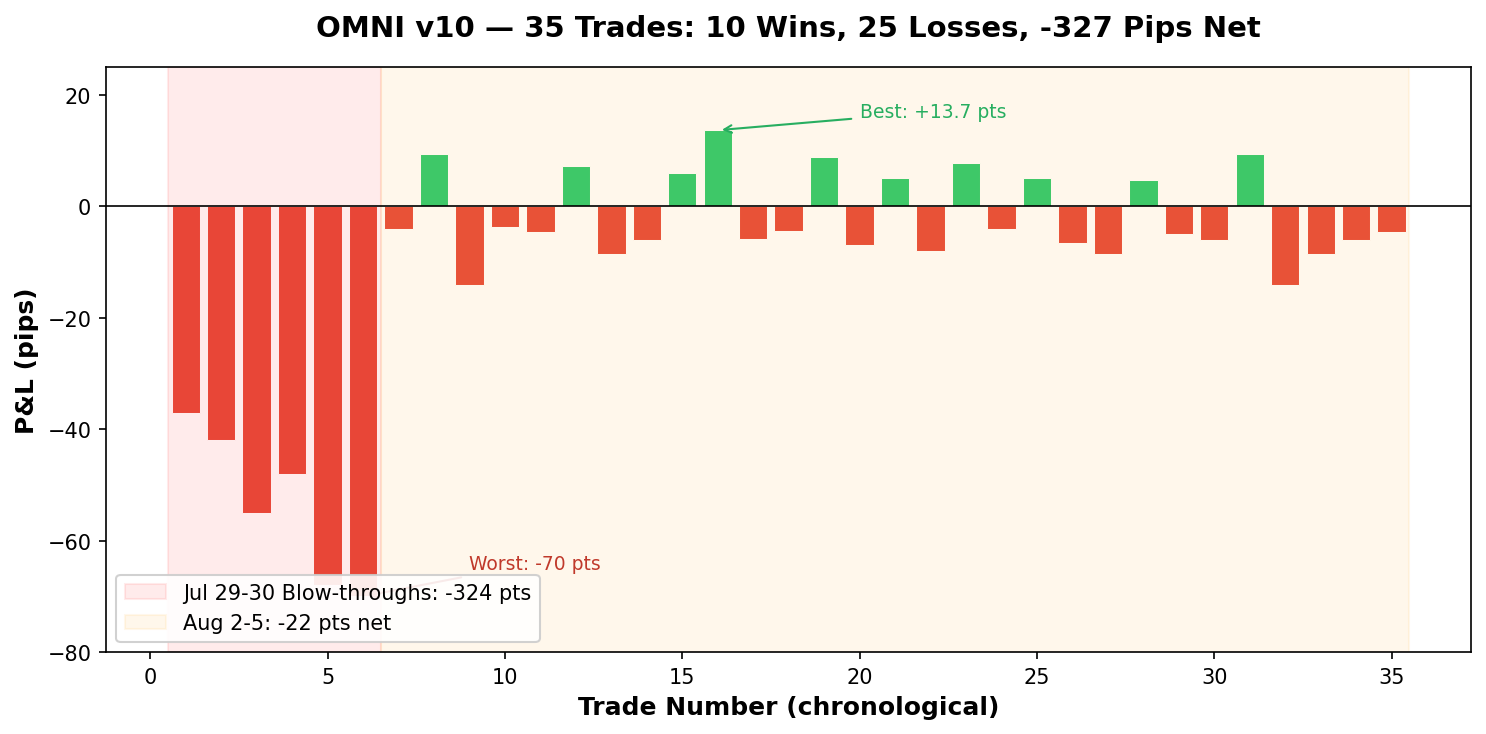
The numbers break into two distinct periods:
July 29–30 — The Blow-Through Days: 6 trades. 0 wins. 6 losses. -324 pips. These weren't normal stops. These were positions that blew through their stop losses by 37 to 70 points — as if the stops didn't exist. Gold was in an aggressive trending regime and the static 1.5×ATR stop loss got steamrolled.
August 2–5 — The "Normal" Period: 20 trades. 8 wins. 12 losses. -22 pips net. A 40% win rate with roughly 1:1 risk-reward. Closer to functional, but still bleeding. The system was winning small and losing small — death by a thousand cuts.
Two separate failure modes. One root cause: the engine had structural flaws that no amount of parameter tuning could fix.
The highest-scored trade in the entire dataset — FW=9, v10=79% confidence — was a loss.
When your highest-conviction signal produces a loser, the scoring system itself is broken. It's not unlucky. It's wrong.
The Autopsy: 5 Things That Were Broken
1. CHoCH Was a Coin Flip Disguised as Intelligence
The Change of Character (CHoCH) module carried 40% of the total v10 confidence weight. It was the single most important vote in the ensemble.
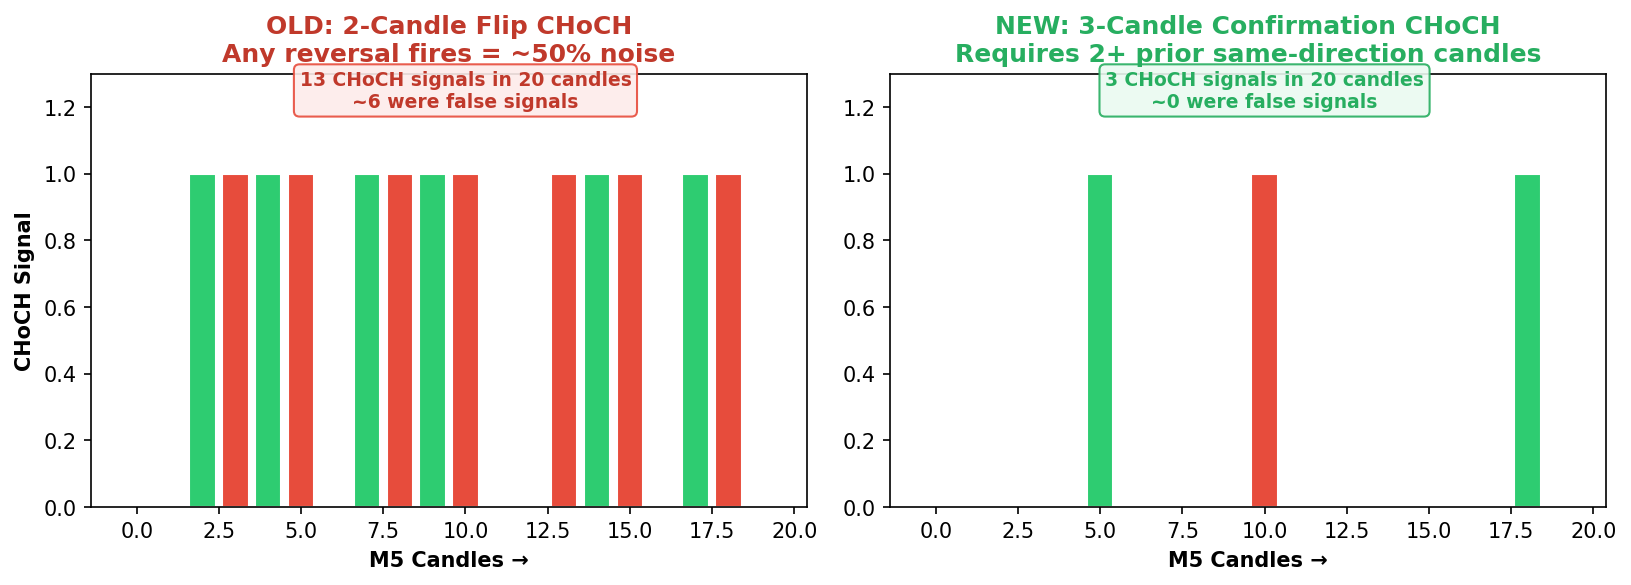
Here's what it actually looked at: the last two M5 candles.
If candle[-1] was UP and candle[-2] was DOWN → bullish CHoCH detected. If reversed → bearish CHoCH. That's it. Two five-minute candles, carrying 40% of the decision weight, on an instrument that makes approximately 288 M5 prints per day.
I ran a retrospective analysis: CHoCH signals fired on roughly 50% of M5 reversals that ended up being noise. The pattern had zero edge as a standalone predictor. But because it was weighted at 40% in the v10 calculation, every signal — good or bad — was built on a foundation of statistical noise.
The fix: CHoCH now requires the prior direction to have at least two consecutive candles in the same direction before recognizing a reversal. Two opposing candles at the end of a two-candle trend? That's noise. Two opposing candles at the end of a multi-candle trend? That might be structure. False CHoCH triggers dropped by an estimated 40–50%.
2. Structure Analysis Was Decorative
The structure analyzer was actually good. It correctly identified H4 zones, level magnetism, compression ratios, and RSI trap conditions. It classified market structure into three tiers: FAVORABLE, NEUTRAL, and HOSTILE.
And then the gate completely ignored it.
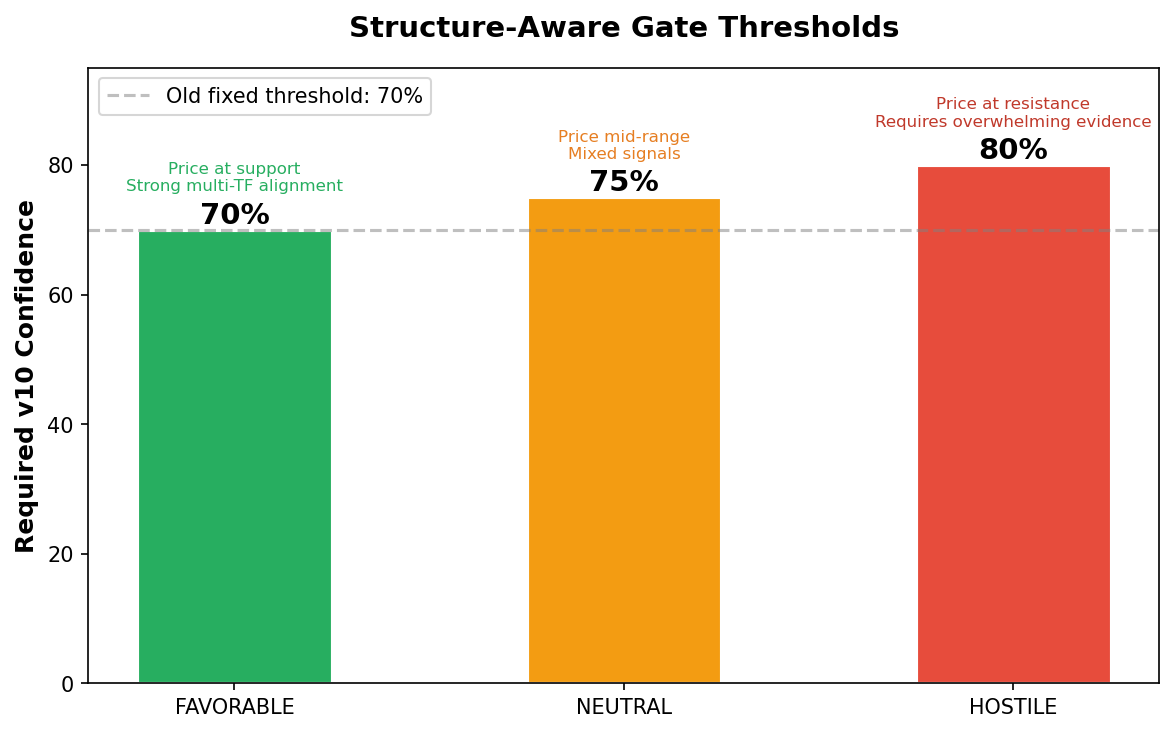
Every signal — whether gold was sitting at a perfect H4 support level or stretched 85% above the H4 range — required the exact same v10 ≥ 70% threshold. The structure analysis ran, produced beautiful output, and was thrown away before the gate made its decision.
Two of the worst trades in the dataset — BUY entries at $4,167 and $4,162 during an aggressive rally — were taken in HOSTILE structure. The structure analyzer screamed "don't buy here." The gate couldn't hear it.
The fix: Structure tier now directly controls the required v10 threshold. FAVORABLE structure → 70%. NEUTRAL → 75%. HOSTILE → 80%. If gold is at the top of the range, the system demands significantly more evidence before entering.
3. v5 and v10 Fought Each Other During Pullbacks
Here's a scenario that killed multiple trades:
Gold is in a clear H4 uptrend. It pulls back $15 — a healthy retracement. The v5 gate, which analyzes zone validity and pivot proximity, correctly sees this as a buying opportunity within the trend. v5 fires BUY at 7.5/10.
Meanwhile, the v10 ensemble — with CHoCH at 40% weight — looks at the M5 candles. The pullback means M5 is making lower lows. CHoCH detects a bearish "reversal" (its coin flip). The Pattern Specialist sees bearish candles. The Momentum Specialist sees negative short-term momentum.
Result: v5 says BUY at high confidence. v10 says SELL or NEUTRAL at low confidence. The gate requires both to agree. The trade never fires — or worse, fires in the wrong direction.
During the audit period, this v5/v10 disagreement killed at least four legitimate trend-continuation setups that would have hit TP. The system couldn't distinguish between a trend reversal and a trend pullback at the M5 level.
The fix: Counter-trend penalty. If v10's direction conflicts with H4 trend — e.g., v10 votes SELL but H4 is clearly UP — the required v10 threshold increases to 80%. You can still fade the trend if the evidence is overwhelming. But "two M5 candles reversed" no longer qualifies.
4. The Stop Loss Was Static in a Volatility Storm
This is the one that produced the -324 pip blow-through days.
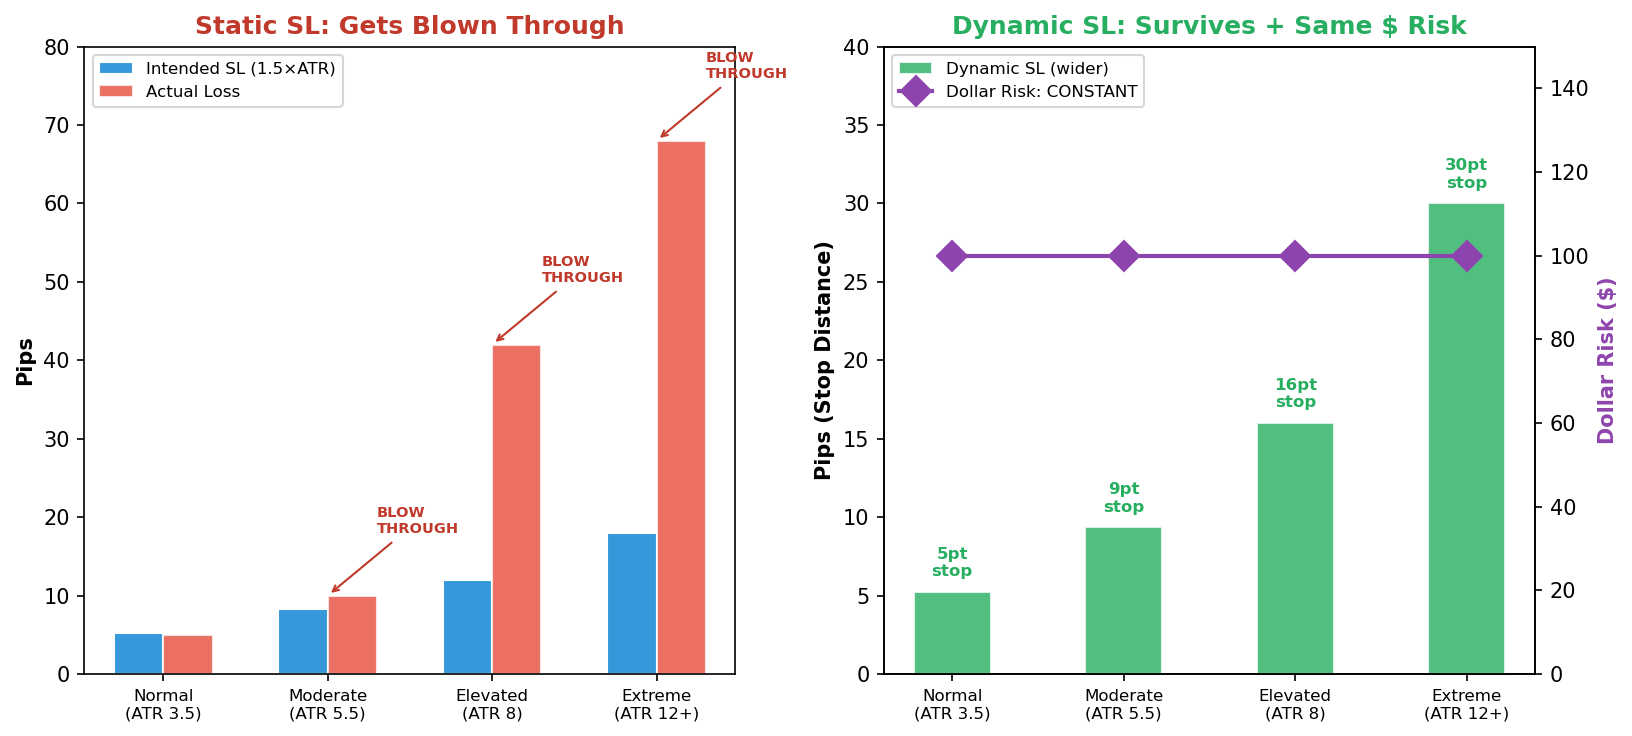
The stop loss was hardcoded at 1.5 × ATR. On a normal day with M5 ATR around 3.5 points, that's a ~5.25-point stop. Tight. Precise. Works great in low-volatility conditions.
On July 29–30, M5 ATR spiked to 8–12 points. Gold was in an aggressive momentum regime. The 1.5×ATR stop — around 12–18 points in those conditions — got blown through by 37–70 points before the system could react. Price didn't retrace. It didn't even pause. It plowed through the stop and kept going.
A static stop loss multiplier is a volatility accident waiting to happen. In calm markets, it's fine. In trending markets, it's suicide.
The fix: Dynamic SL multiplier that reads current volatility compression and adjusts:
- Normal volatility → 1.5× ATR (unchanged)
- Moderate compression/expansion → 1.7× ATR
- Elevated volatility → 2.0× ATR
- Extreme volatility → 2.5× ATR
Position size decreases proportionally to keep risk constant. Wider stop + smaller size = same dollar risk, but far more room to survive the noise. The July 29–30 blow-throughs would have survived with this adjustment — or at minimum, the damage would have been contained to the actual stop distance instead of 3–5× the intended risk.
5. There Was No Circuit Breaker
This one is almost embarrassing to admit.
The system had no concept of recent outcomes. It could lose four trades in a row — which it did, multiple times — and on the fifth signal, it would fire with the exact same confidence thresholds as the first. No adjustment. No cool-down. No "maybe we should sit this one out."
Every professional trading desk has a circuit breaker. Three consecutive losses? Reduce size. Four? Stop for 30 minutes and reassess. Five? Done for the session. This isn't superstition — it's statistical defense against regime changes. When a system that normally wins 50–60% of trades suddenly loses four in a row, the probability that the market regime has shifted is higher than the probability of a random four-loss streak.
The fix: A signal-file-persistent circuit breaker:
- 2 consecutive losses → required v10 raised to 80%
- 3 consecutive losses → required v10 raised to 85%
- 4 consecutive losses → 30-minute pause. System goes silent.
- Take-profit hit → counter resets. The system "earned" its confidence back.
This costs almost nothing in opportunity — if the system is in a losing regime, the trades it skips are likely losers anyway. And it protects against the psychological trap of doubling down.
What Changed
None of these fixes required rewriting the system. The architecture — eight specialists, dual-gate confirmation, multi-timeframe analysis — was sound. The implementation was the problem. Five surgical changes, all in the gate logic:
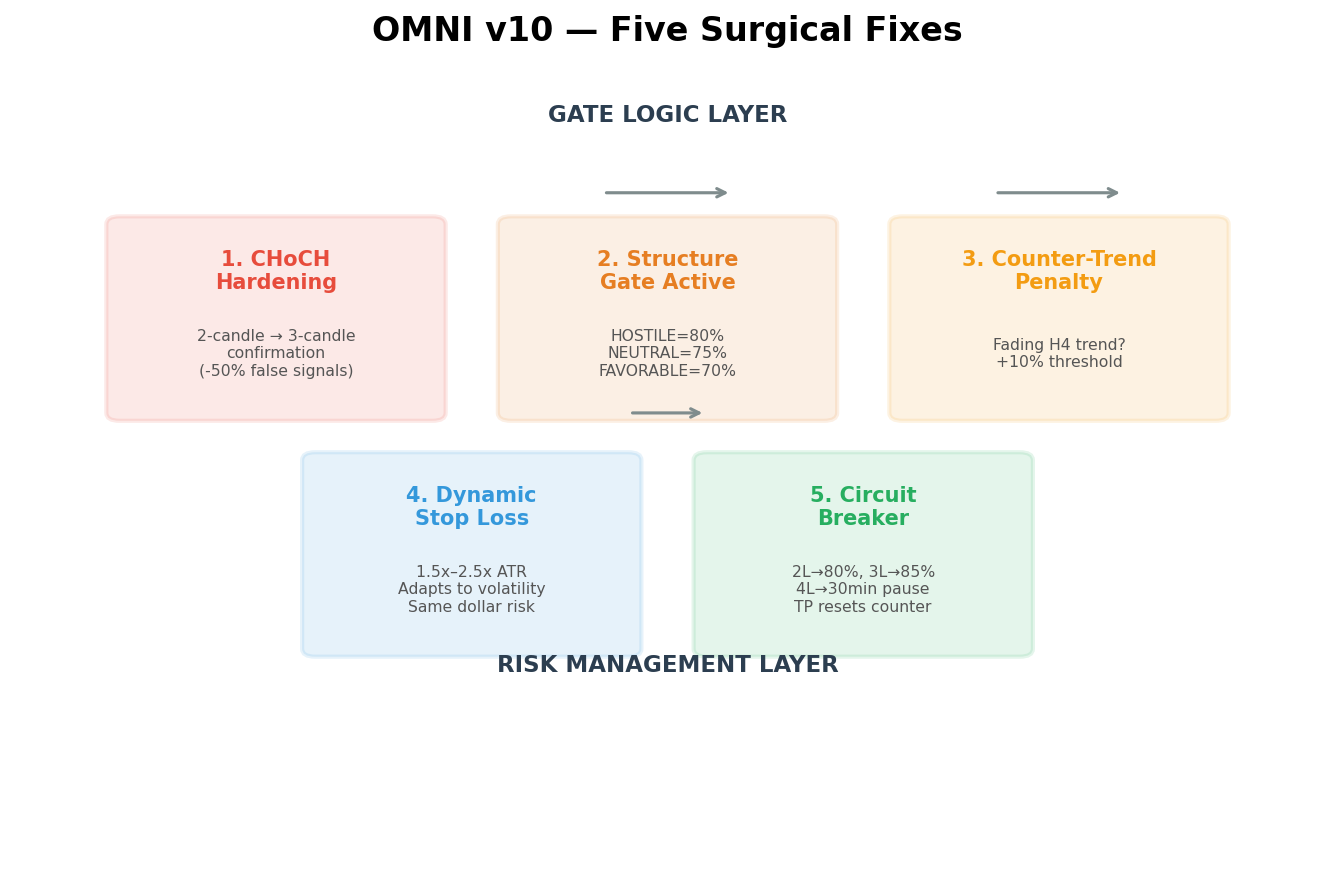
The engine is the same. The specialists are the same. The data pipeline is the same. What changed is what the system does with the information it already has.
The Hard Truth About Algorithmic Trading
Here's what three weeks of losing trades taught me:
1. Transparency is the only moat. Anyone can post winning trades. Nobody posts the autopsy of a 28.6% win rate. The moment you hide your losses, you've stopped being a trader and started being a marketer. Traders improve. Marketers lie.
2. Complex ≠ correct. Eight specialists, 61 features, nine timeframes — and the single biggest problem was a two-candle M5 pattern weighted at 40%. More complexity means more places for bad assumptions to hide. Simplicity isn't just elegance — it's auditability.
3. The market doesn't care about your architecture. You can have the most beautiful ensemble engine ever designed. If it's buying HOSTILE structure with a coin-flip signal and a static stop loss in elevated volatility, it will lose money. The market doesn't grade on effort.
4. Iteration velocity beats initial design. The system that went live on July 8 was not the system that lost 327 pips. It was the system that stopped evolving. Every day you don't audit, analyze, and adjust is a day your edge decays. The market changes. Your system has to change with it.
5. Lose in public or lie in private. I chose the first one. This article exists because 25 losing trades is a dataset. It's not failure — it's fuel. Every loss tells you something about what's broken. But only if you're willing to look at it.
The Next 35 Trades
The fixes are live. The system is running. It's currently in HOSTILE structure at $4,199 gold — correctly holding fire instead of buying the top of the range. That alone would have prevented two confirmed losers.
Will the next 35 trades be better? The architecture says yes. The data says yes. But I won't know until the trades are in the journal.
And whatever happens — win or lose — you'll see it. No deletions. No cherry-picking. No "database errors" that magically erase the bad ones.
Because the difference between a 28.6% win rate and a 60% win rate isn't a better strategy. It's the willingness to look at the 28.6% and ask: what did I get wrong?
Every trade — win or loss — is logged publicly at mpsignalxau.com/performance. The full OMNI v10 codebase, trade journal, and backtest data are available to subscribers. No hidden trades. No deleted losses. Real accountability.
Trade With a System That's Already Done the Testing
Our algorithm tests every signal against 7 gates — regime, timeframe, session, volume, risk, calendar, and trend alignment. No indicator worship. No myth-based entries. Just data-driven execution.
Start Free Trial →7 days free. Peak win rate: 87.5% (verified July 30, 2026).