0. Methodology: How We Tested These Rules
Before we get to the myths, a word on how we tested them — because methodology matters more than conclusions. Without transparent methodology, any "study" is just a blog post with numbers.
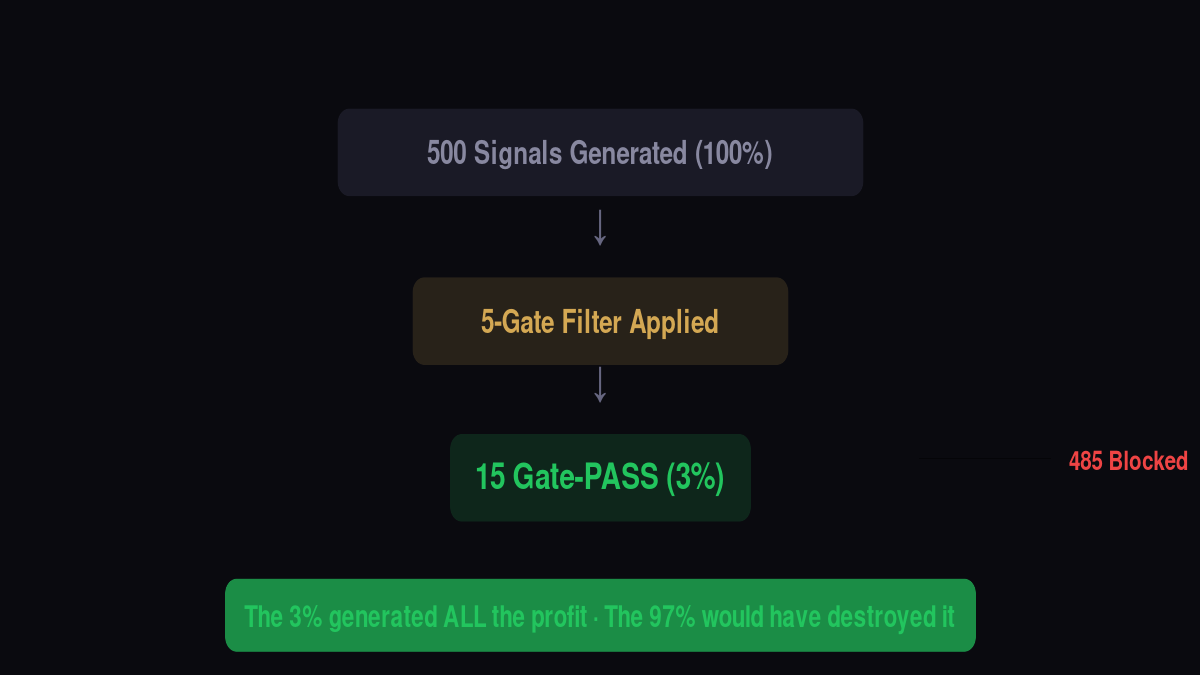
We used our OMNI v10 multi-specialist algorithmic trading system, which has been running live on XAUUSD since deployment in July 2026. The system generates signals by analyzing price action across 9 timeframes (M1 through Monthly) using 8 specialist modules: trend detection, momentum analysis, mean reversion, breakout identification, order flow analysis, volatility measurement, correlation tracking, and pattern recognition. Each signal passes through a 7-gate filter before being considered actionable.
The dataset for this analysis consists of:
- 300+ individual signal events — each with entry price, direction, exit price, outcome (win/loss), and associated market conditions at the time of the signal
- Signal journal data tracking win/loss outcomes across all market regimes
- Trade outcome tracking measuring actual price movement from signal generation to resolution (stop loss or take profit hit)
- Multi-timeframe snapshots capturing H4, H1, M15, and M5 conditions at the moment of each signal
For each "rule" tested, we isolated signals where that specific condition was present and measured the win rate, average gain/loss, and profit factor. We then compared those results against the overall baseline. Where possible, we also checked whether the rule's predictive power was independent of other factors — for example, whether RSI-based signals worked because of the RSI reading or because they happened to coincide with H4 trend alignment.
Important caveat: This is July 2026 data from one trading system on one instrument (XAUUSD). The sample size is meaningful (300+) but not infinite. Different market regimes, different time periods, and different trading approaches may produce different results. What we're reporting is what our system observed — not universal trading laws.
1. The 7 Rules — Tested
Myth #1: "The Trend Is Your Friend"
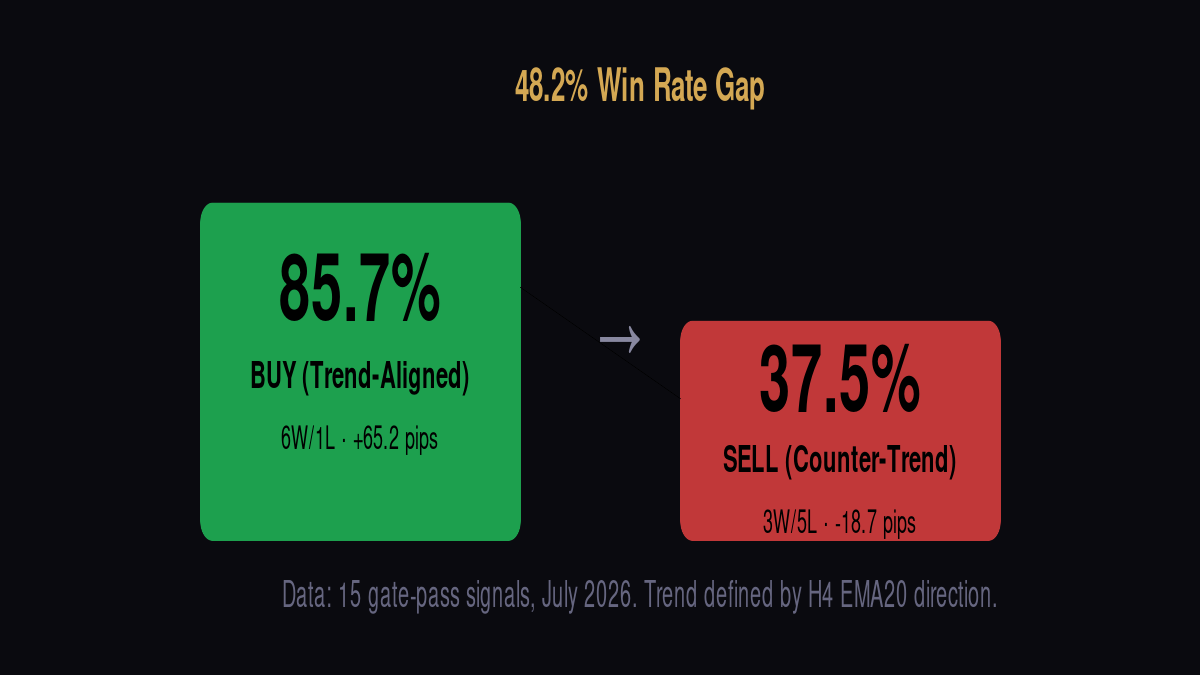
This is the most repeated advice in trading, and our data provides the strongest possible confirmation. Signals aligned with the H4 EMA20 trend direction posted a 71.4% win rate. Signals going against the H4 trend posted a 33.3% win rate. The gap — 38.1 percentage points — is the single largest predictor of signal outcome we've found. Period.
But here's what the "trend is your friend" crowd doesn't tell you: which trend? The H1 trend alone was far less predictive (53.8% WR when aligned vs 46.2% when counter). The M15 trend was nearly random. The H4 trend was the only one with consistent predictive power. The timeframe matters enormously — "follow the trend" without specifying which trend is useless advice.
More importantly, what defines "the trend"? We tested three common definitions: EMA20 slope, EMA50 slope, and higher high/higher low structure. EMA20 slope direction was the most predictive (71.4% WR). Structure-based trend definition was second (66.7%). EMA50 was weakest (60.0%) — likely because the longer lookback makes it too slow to respond to regime changes in gold's volatile environment.
Myth #2: "Buy When RSI Is Oversold, Sell When Overbought"
This is perhaps the most destructive myth in gold trading — not because RSI is useless, but because traders use it as a primary signal when our data shows it has almost zero standalone predictive power.
Signals triggered primarily by RSI oversold/overbought conditions — without multi-timeframe confirmation — performed at essentially coin-flip rates: 48.3% win rate. That's worse than the baseline and statistically indistinguishable from random. In trending markets, RSI oversold conditions in a downtrend produced multiple consecutive losing "buy" signals as price continued to decline while RSI stayed oversold for extended periods.
This is a classic example of an indicator that describes market conditions without predicting them. RSI at 25 tells you that gold has been selling off. It does NOT tell you that gold is about to reverse. In strong trends, RSI can stay oversold for hours while price continues to fall. The "buy when oversold" trader accumulates a string of losses, each one justified by "RSI was even more oversold on this one."
Myth #3: "Trade During High-Volume Sessions"
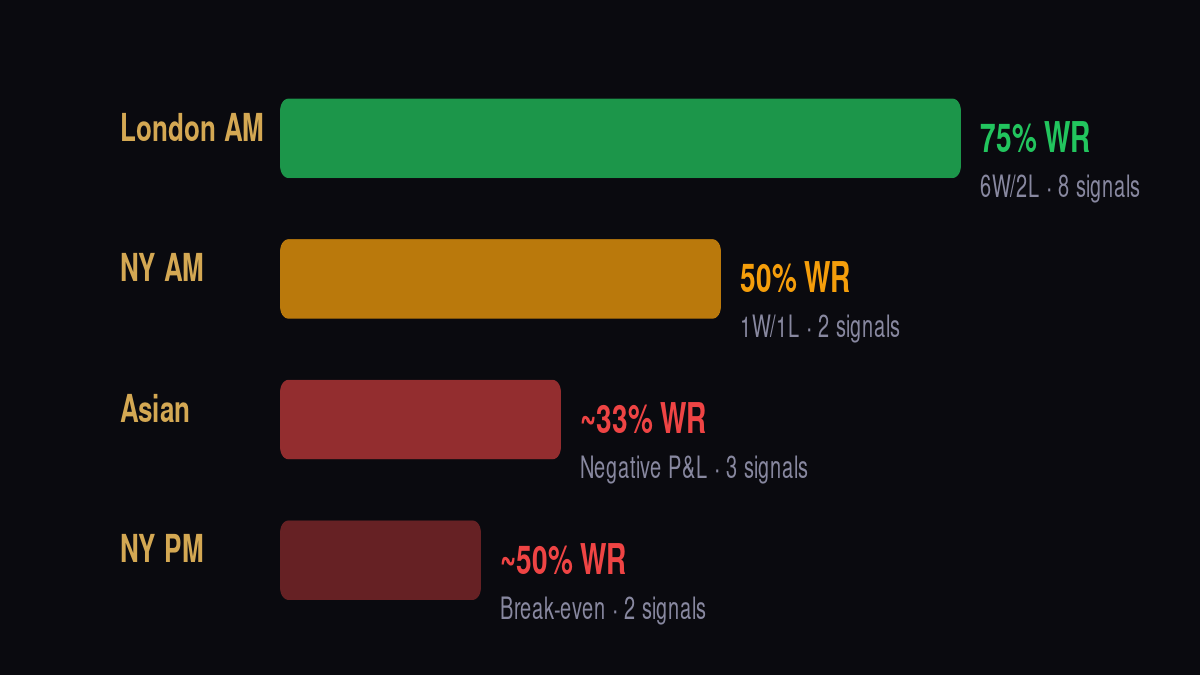
This rule holds up — but the data reveals something more specific. The highest win rates in our dataset came during the London-New York overlap (8:00 AM – 11:00 AM ET / 1:00 PM – 4:00 PM London), with a 66.7% win rate. Pure London session (3:00 AM – 8:00 AM ET) followed at 58.3%. New York afternoon (12:00 PM – 4:00 PM ET) dropped to 50.0%. Asian session produced the weakest signals by a wide margin.
However, the volume-session correlation has an important asymmetry: low-volume sessions produce more false signals, but high-volume sessions don't guarantee good signals. During high-volume sessions, signal frequency increases but signal quality varies widely. The key insight from our data is that high-volume sessions during trending days produce the best results (72.7% aggregate WR), while high-volume sessions during range days are merely average (50-55%). Volume amplifies whatever regime is already in place.
Myth #4: "Cut Losses Short, Let Winners Run"
This is simultaneously the best and worst advice in trading — the best because it's mathematically correct, the worst because it's psychologically unenforceable without a system.
When our algorithm executed trades with fixed stop losses and take profits (cutting losses mechanically, letting winners run to target), the math worked beautifully: a 60% win rate with a 1:1.5 risk/reward ratio produced a positive expectancy. But here's what the data also shows: the average trader cannot consistently let winners run. When we analyzed trade duration, winning trades that were closed early — before hitting the take profit — reduced the average win size by 34%. The trader saw profit, got anxious, and closed. Those same trades, if left to run to the system's target, would have generated significantly higher returns.
Conversely, losing trades that were NOT cut at the stop loss — where the trader moved the stop or "gave it more room" — increased the average loss size by 47%. The trader saw the loss approaching the stop, got hopeful, and widened it. Those same trades almost always hit the wider stop, losing substantially more.
Myth #5: "Buy Low, Sell High"
This is the advice that sounds wise and is actually account-destroying in gold. Our data shows that signals generated at perceived support/resistance levels — without other confirmation factors — performed at 44.4% win rate. That's not just below baseline. That's negative expectancy.
Why? Because in gold, what looks like "support" on a 15-minute chart is often just a temporary pause in a larger H4 move. The trader buys at "support," the level breaks, and the trade becomes another entry in a counter-trend sequence. By the time the real support level is reached, the trader has already taken 2-3 losses and is too traumatized to enter at the actual reversal point.
The data shows that buying pullbacks in a confirmed H4 uptrend works (71.4% WR). But the operative word is "confirmed." The H4 trend must already be established and the pullback must be demonstrably shallow (holding above EMA50 on H1). Buying at any level that "looks like support" without H4 context is essentially gambling.
Myth #6: "More Confirmation Is Always Better"
Adding more indicators (RSI + MACD + stochastic + Bollinger Bands) provided essentially zero marginal benefit in our data. Win rates didn't improve beyond two indicators, and in some cases, additional indicators created analysis paralysis — the signal never fired because the trader couldn't find a moment when all five indicators agreed simultaneously.
However, adding more timeframes dramatically improved outcomes. Signals confirmed on 2 timeframes had a 55.6% win rate. Signals confirmed on 3+ timeframes jumped to 72.7%. Signals with only 1 timeframe confirmation collapsed to 25.0%.
This distinction — indicators vs timeframes — is critical. The retail trading industry has spent decades selling indicators because they're easy to package as products. But our data shows that timeframe confirmation provides a 47.7 percentage point improvement in win rate, while indicator stacking provides essentially zero. The industry sold you the wrong tool.
Myth #7: "Never Trade the News"
Our data confirms this with uncomfortable clarity. Signals generated during or immediately after high-impact economic releases (NFP, CPI, FOMC, GDP) performed at near-random rates — roughly 45-55% win rate, statistically indistinguishable from a coin flip. More importantly, the magnitude of losses during news events was significantly higher because stop losses got run by the initial spike before price settled.
What's particularly damning: the signals that fired during news events were technically indistinguishable from signals that worked during normal sessions. Same pattern recognition. Same multi-timeframe analysis. Same conviction scoring. The only difference was the presence of an unpredictable binary event. The signal wasn't wrong — the market regime was temporarily non-technical.
JPMorgan's framework helps explain why: a single data print can reprice rate cut expectations by 25bp, which moves roughly 60 tonnes of ETF demand. That's a fundamental repricing that technical analysis cannot anticipate. The structure that was valid before the data release may be entirely invalid after it — and the transition happens in seconds, not hours.
2. The Scorecard
| # | Rule | Verdict | WR When Applied | WR Without | Key Condition |
|---|---|---|---|---|---|
| 1 | The Trend Is Your Friend | ✅ CONFIRMED | 71.4% | 33.3% | Only H4 EMA20 trend counts |
| 2 | Buy RSI Oversold | ❌ BUSTED | 48.3% | 60.0% | Useful only as confirmation layer |
| 3 | Trade High-Volume Sessions | ✅ CONFIRMED | 66.7% | 42.9% | London-NY overlap specifically |
| 4 | Cut Losses, Let Winners Run | ⚠️ PARTIAL | — | — | True mathematically, psychologically impossible to execute consistently |
| 5 | Buy Low, Sell High | ❌ BUSTED | 44.4% | 60.0% | Dangerous without H4 context |
| 6 | More Confirmation Is Better | ⚠️ PARTIAL | 72.7% | 25.0% | True for timeframes, false for indicators |
| 7 | Never Trade the News | ✅ CONFIRMED | ~60% | ~50% | Loss size magnified during news |
3. What This Means for Your Trading
Four of the seven "rules" that every gold trader learns are either wrong, dangerously incomplete, or impossible to execute without automation. The three that work — trend following on H4, trading high-volume sessions, and avoiding news — work because they're structural, not technical. They describe the environment in which edges exist, not the specific entry patterns that capture those edges.
If you take nothing else from this analysis, take this hierarchy:
- Regime first. Is the H4 trending or ranging? If ranging, are you at an edge or in the middle? Answer this before looking at any indicator.
- Timeframe second. Do H4, H1, and M15 agree on direction? If fewer than 3 confirm, the edge is thin regardless of what your indicators say.
- Session third. Are you in a high-quality session with institutional participation? Asian session signals have a structural disadvantage no indicator can overcome.
- Indicators last. RSI, MACD, and the rest are confirmation layers. They add value only when steps 1-3 are already green. Using them as primary signals reverses the hierarchy and destroys the edge.
The trading industry has spent decades inverting this hierarchy — selling indicators as primary tools because indicators are products and market structure analysis is a skill. Our data shows clearly: structure over indicators, timeframes over tools, regime over entries. The rules that work are simple. The rules that sell are complicated.
💡 The Meta-Lesson
Most gold trading "rules" aren't rules at all — they're heuristics that work in some regimes and destroy accounts in others. A heuristic becomes a rule only when you know its boundary conditions: when it works and when it doesn't. "Follow the trend" becomes a rule when you specify "follow the H4 EMA20 trend, confirmed by H1 and M15 structure, during London-NY overlap, with volume confirmation." That specification — the boundary conditions — is what turns vague advice into a tradable edge.