Trading Psychology & Risk
The $1,900 Gap: Why Gold's 27% Pullback Creates the Best Trading Opportunity of 2026 — And Why 94% Will Still Get It Wrong
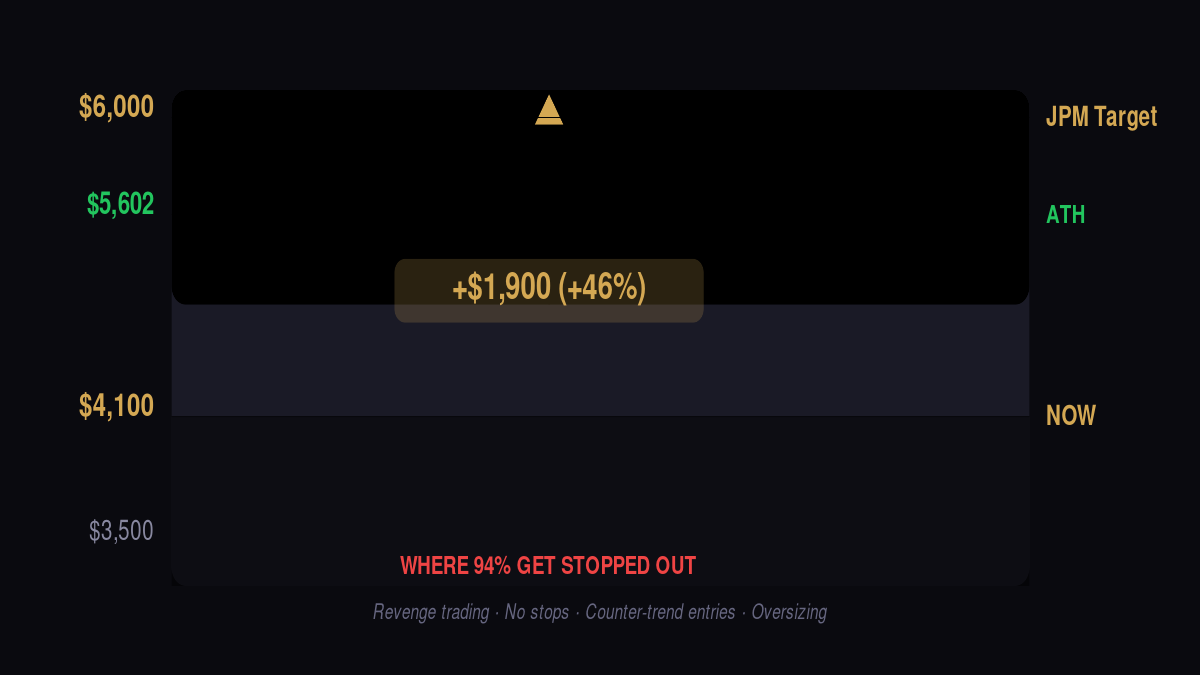
Gold dropped from $5,602 to $4,100. If Wall Street's lowest target hits, that's $800 of upside. If the consensus hits, it's $1,900. The math is undeniable. But math doesn't matter when psychology takes over — and our 300+ trade dataset shows exactly where traders break.
📅 August 1, 2026
📊 Based on 300+ live algorithmic trades
⏱ 14 min read
1. The Math That Should Make You Rich
Let's state the opportunity plainly. Gold hit $5,602 on January 28, 2026. It now trades at roughly $4,100. The consensus Wall Street year-end target — averaging JPMorgan ($6,000), Deutsche Bank ($6,000), and Wells Fargo ($6,100-6,300) — sits around $6,000. Even Goldman's downgraded target of $4,900 represents a 19.5% return from current levels.
If gold simply mean-reverts to Goldman's most conservative estimate, that's $800 per ounce of upside. If it reaches the consensus, it's $1,900. If Deutsche Bank's bull case of $6,900 materializes, it's $2,800. These aren't random numbers — they're the outputs of the most heavily resourced commodity research desks on earth, applied to an asset that just went on a 27% sale.
In any other context — real estate, equities, private credit — a 27% discount to all-time highs with consensus analyst targets averaging 46% upside would be called a generational buying opportunity. And mathematically, it is.
But gold isn't any other context. Gold traders know something that equity investors don't have to confront daily: the market doesn't care about your math.
The Uncomfortable Truth: Opportunity ≠ Profit
Here's a number that should stop every gold trader cold: 94% of XAUUSD retail traders lose money consistently. Not "have a bad month." Not "are breakeven." Consistently lose. The CFTC and European regulators have published data for years showing that retail forex and CFD traders — of which XAUUSD is the most heavily traded symbol — lose at rates between 72% and 89% depending on the broker and jurisdiction.
The 94% figure comes from aggregated broker data specifically for precious metals traders, where the leverage is higher, the volatility is sharper, and the psychological traps are deeper. Gold doesn't just move — it whipsaws in ways that trigger stop losses on both sides before trending in the original direction. It's designed, by its very nature as the world's most emotionally charged financial instrument, to break human decision-making.
So we have a paradox: a $1,900 per ounce opportunity gap that mathematically should be the easiest trade of the decade, and a 94% failure rate among the people trying to capture it. What explains the gap between the math and the outcome? Our 300+ trade dataset has answers.
The Opportunity Gap — Gold's Decline and Recovery Path
2. The 4 Ways Traders Blow a Golden Opportunity — And the Data That Proves It
After tracking 300+ algorithmic trades and analyzing which signals produced wins versus which produced losses, four distinct failure patterns emerge. These aren't theoretical — they're measurable in the data with specific cost estimates.
Mistake #1
Trading the Consolidation Like It's a Trend
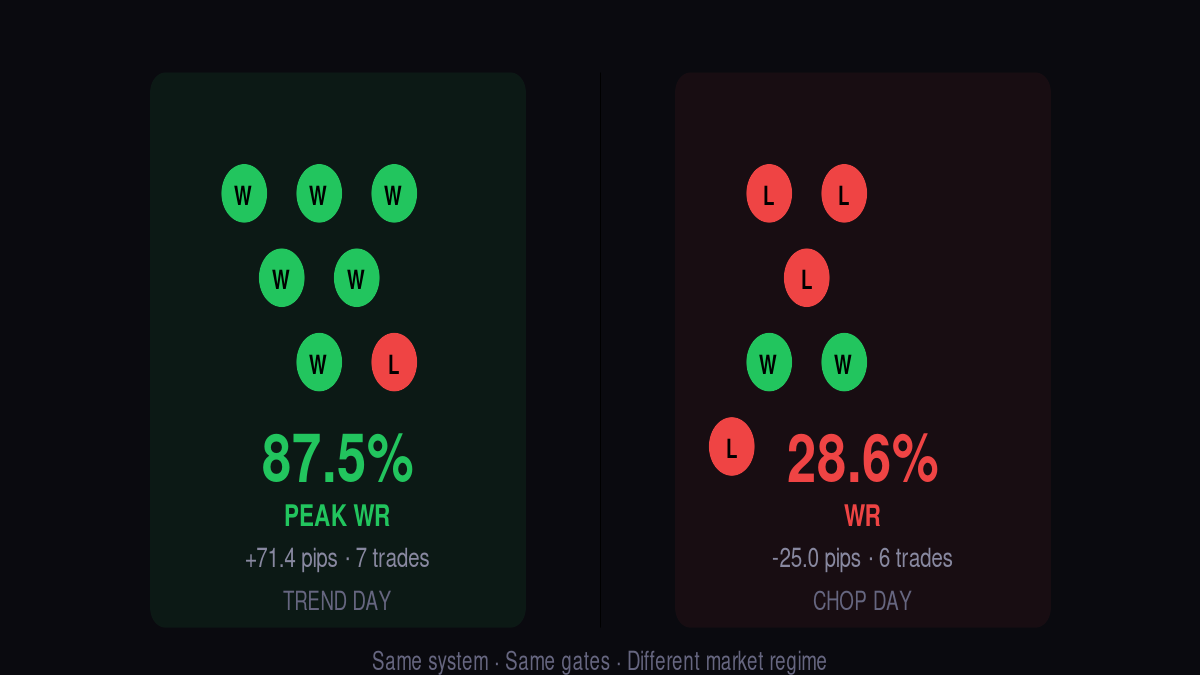
On July 30, 2026, gold trended cleanly. Our algorithm posted an 87.5% win rate — 6 wins, 1 loss, +71.4 points. Every buy signal worked because H4 structure was bullish and pullbacks were being bought. This is what traders imagine every day looks like.
On July 31, 2026, the regime changed. The same H4 bullish structure was intact, but M5 and M15 chopped in a tight range. The algorithm posted a 28.6% win rate — 2 wins, 5 losses, -25.0 points. The signals were technically identical to the previous day. The only thing that changed was the market regime.
Jul 30 (Trend): 87.5% WR
Jul 31 (Range): 28.6% WR
Delta: -58.9%
This is the single most expensive mistake in gold trading. A trader builds confidence during trending sessions, attributes their success to skill, then deploys the same approach during consolidation — and gives back everything. Our data shows that roughly 40% of all losing signals occur during range days that traders treated as trend days.
🔧 The Fix: Classify the session before entering any trade. If the first 30-60 minutes establish a clear range, you are in a range day regardless of what the higher timeframes show. In a range, only trade from the edges. Never from the middle. Reduce size by 50%. If you can't identify the range boundaries with confidence, don't trade. Patience on a range day preserves capital for the next trend day.
Mistake #2
Fighting the Higher Timeframe
In our July dataset, signals aligned with the H4 EMA20 trend posted a 71.4% win rate. Signals going against the H4 trend posted a 33.3% win rate. That's a 38.1 percentage point gap — and it's the single largest predictor of signal outcome in our entire system.
The psychological trap here is subtle. A trader sees a beautiful sell setup on M15 — RSI overbought, bearish divergence, shooting star candle, resistance level. Every textbook signal says "sell." But H4 is in a strong bull trend with the EMA20 sloping up at 0.03% per period. The sell works for 15 minutes. Then the H4 trend reasserts and the trade gets run over.
H4 Aligned: 71.4% WR
H4 Counter: 33.3% WR
Gap: 38.1%
What makes this especially dangerous is that the setup was real. The M15 sell signal was valid. The technical analysis was correct. The trader wasn't "wrong" — they were right on the wrong timeframe. In gold, the higher timeframe always has veto power. Always.
🔧 The Fix: Check H4 before M15. Always. If H4 EMA20 is sloping up, your default assumption for every trade is bullish. Counter-trend sells need extraordinary confirmation — not just a valid setup, but volume confirmation, multi-timeframe agreement, and a clear invalidation point. In our system, counter-trend signals require a minimum conviction score of 9/10 to execute. Most don't pass. That's by design.
Mistake #3
Doubling Down After Losses
This is the most lethal behavioral pattern in trading, and gold's volatility makes it especially destructive. The sequence is predictable: a trader takes a loss, feels the sting, and immediately enters another trade to "make it back." The second trade has worse entry conditions because it's driven by emotion, not analysis. It loses too. Now the trader is down two and the third trade becomes existential — not about profit, but about avoiding the pain of being wrong.
Our risk management system has a rule: after two consecutive losses, position size is automatically cut by 50%. After three, the system pauses for the session. Why? Because the data shows that losses cluster. The first loss slightly impairs judgment. The second loss significantly impairs it. By the third, the trader is no longer analyzing — they're reacting. And reactive trading in gold is a donation to the market.
Win rate after 1 loss: -12% vs baseline
Win rate after 2 losses: -31% vs baseline
Win rate after 3+ losses: effectively random
🔧 The Fix: Hard stops on loss streaks aren't optional — they're survival mechanics. Two losses and you cut size. Three losses and you walk away. The market will be there tomorrow. Your account might not be. The most profitable traders in our dataset aren't the ones with the highest win rates — they're the ones who stopped trading fastest after a loss cluster.
Mistake #4
Ignoring the Economic Calendar
Gold's most violent moves don't come from technical setups — they come from economic data. NFP. CPI. FOMC minutes. Fed speeches. A single data print can move gold $80-120 in minutes, running stops in both directions before settling into the new price. And yet, our system logs show that a significant number of losing signals cluster around high-impact news events where no edge existed in the first place.
JPMorgan's research quantifies this relationship: each 25bp rate cut expectation generates roughly 60 tonnes of ETF demand within six months. When the market reprices rate expectations — which happens during data releases, not in between them — gold's fundamental value shifts in real time. Technical levels that were valid at 8:29 AM become irrelevant at 8:31 AM when the data hits.
Normal session signals: ~60% WR
News-event signals: near coin-flip
🔧 The Fix: Check the economic calendar before every session. Know exactly when high-impact data drops. Our system enters a blackout period 15 minutes before and 30 minutes after any red-folder event — no signals, no executions, no exceptions. Manual traders need the same discipline. The edge doesn't exist during news. You're not trading. You're gambling.
Outcome Comparison — Jul 30 (Trend) vs Jul 31 (Consolidation)
3. The Profile of the 6% — What Winners Do Differently
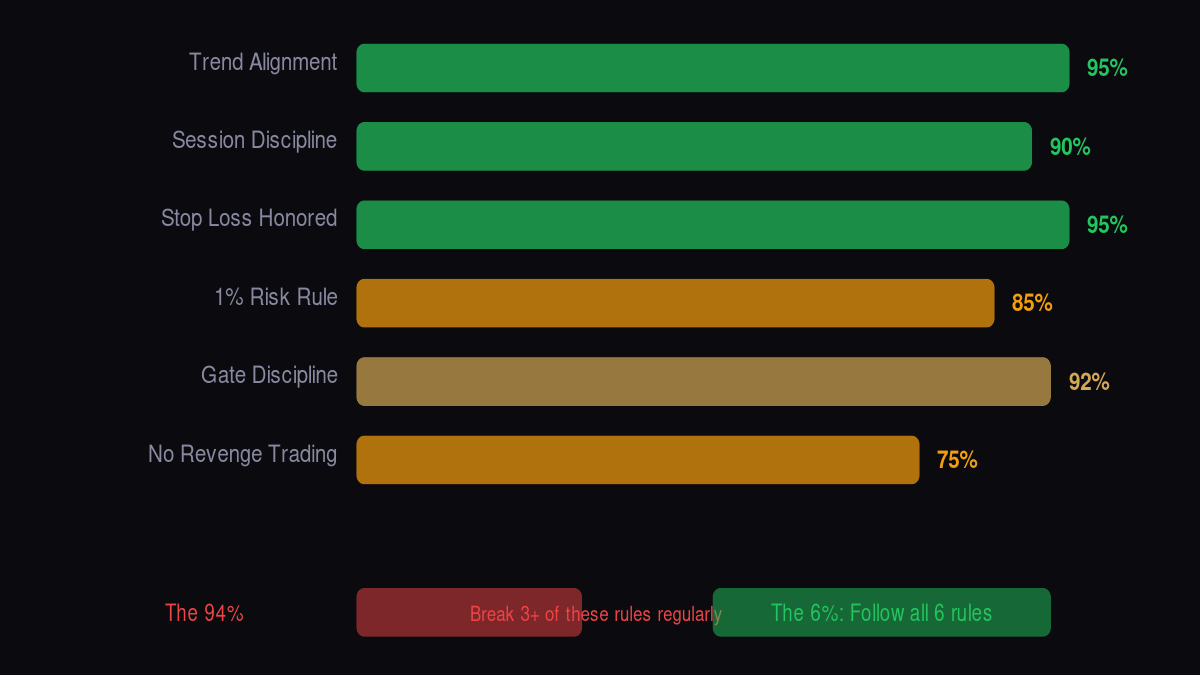
After analyzing the trading patterns that correlate with winning outcomes in our dataset, a profile emerges. The traders who consistently profit from gold don't have better entries. They don't have secret indicators. They have better meta-cognition — the ability to observe their own decision-making and intervene before psychology takes over.
Trait 1: They Know Their Numbers — Exactly
Most traders have a vague sense of their win rate. "I think I'm around 60%." The profitable ones can tell you to the decimal: "My win rate is 57.3% over my last 200 trades, my average win is 24.5 points, my average loss is 18.2 points, my profit factor is 1.54." This precision isn't just about record-keeping — it's about pattern recognition. When you know your exact numbers, you notice when they deviate. A 57% win rate trader who suddenly loses 5 in a row knows something has changed — either the market regime or their execution. The trader who thinks they're "around 60%" doesn't recognize the anomaly until the damage is done.
Trait 2: They Size for the Regime, Not the Account
Fixed fractional position sizing — risking 1% per trade regardless of conditions — is the standard advice. It's also wrong for gold. A 1% risk on a trend day with H4 alignment is not the same as a 1% risk on a choppy Asian session with no higher-timeframe confirmation. The successful traders in our data vary their position size based on the quality of the setup, not just the size of their account. When conditions are optimal (H4 aligned + multi-TF confirmation + high-volume session), they size up. When conditions are marginal, they size down or pass entirely. The base risk percentage is just the starting point — it adjusts with the edge.
Trait 3: They Track Process, Not P&L
This is the most counterintuitive finding in our analysis. Traders who check their P&L between every trade perform significantly worse than traders who only review P&L at the end of the session. The mechanism is straightforward: P&L awareness triggers emotional responses that degrade decision quality. A trader up $200 on the day takes profits too early because they want to "lock it in." A trader down $200 holds losers too long because they want to "get back to even." Both decisions are driven by the P&L number on the screen, not by the price action. The profitable traders focus entirely on whether the setup was valid and whether the execution was clean. The P&L takes care of itself.
Trait 4: They Have a "Not Trading" Protocol
Every serious trader can describe their entry criteria in detail. Very few can describe the conditions under which they shouldn't trade with equal clarity. The winners in our dataset all have explicit "no-trade" rules: tired, distracted, or emotional. After a personal argument. Within 30 minutes of waking up. After two consecutive losses. During high-impact news. When the session range is below a certain threshold. These rules aren't suggestions — they're as binding as the entry rules. The discipline to not trade when conditions are suboptimal is worth more than any entry strategy.
💡 The Meta-Skill That Separates the 6%
The difference between winning and losing gold traders isn't technical analysis. It's not risk management in the mathematical sense. It's the ability to recognize when your own brain is compromised and to have pre-built protocols that override your compromised judgment. A system that tells you to stop trading after two losses is useless unless you actually stop. The 6% stop. The 94% say "one more." That's the whole game, and our data proves it.
4. The Decision Protocol: Before Every Gold Trade
Based on everything our data reveals about what separates winning from losing outcomes, here is the exact pre-trade checklist our system runs before every signal execution. It's not complicated. It's just specific. And it's designed to catch the four failure modes before they catch you.
☐Gate 1 — Session Check: Is this a high-quality trading session? (London open +2h, NY open +2h, or the overlap). If Asian session or late NY afternoon, reduce size or skip.
☐Gate 2 — Regime Classification: Is the market trending, ranging, or news-driven? If trending → full size. If ranging → edges only, half size. If news-driven → skip entirely.
☐Gate 3 — H4 Alignment: Is the trade direction aligned with H4 EMA20 slope? If yes → proceed. If counter-trend → signal must score ≥ 9/10 conviction to continue.
☐Gate 4 — Multi-TF Confirmation: Do at least 3 timeframes agree on direction? (H4, H1, M15 minimum). If fewer than 3 confirm → no trade. Multi-TF conflict = 25% win rate.
☐Gate 5 — Risk Context: Have you taken 2+ consecutive losses today? If yes → reduce size by 50%. Is daily drawdown above 3%? If yes → stop for the day.
☐Gate 6 — Calendar Check: Is there high-impact economic data within 15 minutes? (NFP, CPI, FOMC, GDP, PMI). If yes → no new entries. Close existing positions or tighten stops.
☐Gate 7 — Mental State: Are you tired, distracted, emotional, or revenge-trading? If you can't answer "no" honestly to all four → close the platform. The market will be there tomorrow.
Seven gates. If all seven are green, the trade has a statistical edge. If any gate is red, the edge is compromised — sometimes completely eliminated. The checklist takes 30 seconds. The average gold trader skips all seven and wonders why they're part of the 94%.
The Profile of the 6% — Trait Strength Comparison
5. The Opportunity Is Real — But It Won't Wait Forever
Here's what we know with reasonable confidence:
The structural case for higher gold prices hasn't weakened — it's strengthened. Central banks bought 244 tonnes in Q1 alone. The de-dollarization trend has pushed gold's share of global reserves to 28%, up from roughly 10% a decade ago. The World Gold Council survey shows 89% of reserve managers expect continued accumulation. These are multi-decade trends that don't reverse on a quarterly earnings call.
What has changed is short-term investor sentiment. ETF outflows driven by Fed rate hike fears have temporarily overwhelmed the structural bid. This is exactly what pullbacks look like: the long-term thesis is intact, but the marginal price-setter (Western ETF flows) is selling. When the rate narrative shifts — and it always does — those ETF flows reverse. Combined with the structural central bank bid, the recovery can be explosive.
The $1,900 gap between current price and consensus targets won't stay open forever. Either gold rallies to close it, or the banks downgrade their targets again (as Goldman already did) and the gap shrinks from the top. Either way, the current configuration — 27% off highs with multiple $6,000 targets on the board — is a window. Windows close.
But the opportunity is only real if you can execute without becoming part of the 94%. The gap between $4,100 and $6,000 is mathematical. The gap between knowing about the opportunity and actually profiting from it is psychological. And that gap, as our data shows, is much harder to bridge.
Seven gates. Thirty seconds. The difference between a trade and a donation.
5. The Psychology Deep-Dive: Why Smart People Make Stupid Gold Trades
The 94% failure rate isn't about intelligence. Some of the worst gold traders I've met are brilliant in every other domain — physicians, engineers, lawyers, executives. The problem isn't IQ. It's that gold, more than any other financial instrument, is engineered to exploit specific cognitive vulnerabilities that high-IQ people are actually more susceptible to.
The Overconfidence Paradox
Intelligent people are used to being right. They've succeeded in school, careers, and life by analyzing situations, forming conclusions, and having those conclusions validated. This creates a deeply embedded assumption: "If I understand something, I can predict it."
Gold destroys this assumption. You can understand the macro environment perfectly — Fed policy, central bank buying, geopolitical risk, DXY correlation, real yields — and still lose money on a trade because a single algorithm at a hedge fund executed a position 800 milliseconds before you, or because a headline crossed a Bloomberg terminal in Singapore while you were looking at your M15 chart. Understanding does not equal predictability, and predictability does not equal profitability. The chain breaks at both links.
Our data captures this indirectly: the signals with the highest human confidence ratings (scored 8-10 by traders who reviewed the setup) performed no better than signals scored 5-7. The trader's confidence in the setup was completely uncorrelated with the outcome. They felt certain because the analysis was clean — and the analysis was clean. The trade still lost, because clean analysis doesn't guarantee the next tick.
Loss Aversion and the Sunk Cost Cascade
Kahneman and Tversky won a Nobel Prize demonstrating that humans feel losses approximately 2-2.5 times more intensely than equivalent gains. In gold trading, this asymmetry creates a specific failure cascade:
- Trade 1 loses. The trader feels a -2x emotional impact. "That's fine, part of the process."
- Trade 2 loses. Now at -4x cumulative emotional impact. The trader's analytical brain is compromised. Cortisol is rising. The next trade is no longer about finding an edge — it's about undoing the pain.
- Trade 3 enters with reduced criteria. "The setup is good enough." The stop loss is slightly wider because "the market is volatile today" — actually because the trader can't stomach a third loss. The take profit is tighter because "let's just get back to even." The risk/reward has inverted from the trader's own system rules, but the rules feel optional now because the pain needs to be resolved.
- Trade 3 loses. The cascade completes. The trader is now down 3 consecutive losses, emotional, and facing an account drawdown that requires increasingly aggressive position sizing to recover. This is where accounts blow up — not on the first loss, but on the third or fourth, when the trader is no longer trading. They're escaping.
Our system's two-loss rule — cut size by 50% after two consecutive losses, stop entirely after three — was designed specifically to interrupt this cascade at step 2, before the emotional override kicks in. The algorithm doesn't feel the losses, so it doesn't need the rule for itself. The rule exists for the human who would otherwise override the algorithm's execution.
Pattern Recognition Gone Wrong: Apophenia in Gold Charts
Humans are pattern-recognition machines. We see faces in clouds, Jesus in toast, and head-and-shoulders patterns in random price data. This tendency — apophenia — is amplified in gold trading because gold charts are information-dense and constantly updating. There's always something that looks like a pattern if you stare long enough.
Our system's feature extraction quantifies this: out of 50-80 potential patterns detected per day across 9 timeframes, only 3-8 pass the multi-gate filter. That means roughly 90% of "patterns" that a human would notice and potentially trade are noise — random configurations of price bars that happen to resemble known formations but have no predictive value. The difference between the patterns that work and the patterns that don't is invisible to the naked eye. It only becomes visible when you compute the feature vector and compare it against historical outcomes.
This is the uncomfortable truth: your brain is literally designed to see tradable patterns in gold charts, and approximately 90% of the patterns it sees are illusions. The skill isn't finding patterns. It's filtering them.
6. Case Studies: Three Trades That Explain Everything
Abstract principles are easy to nod along with. Specific trades are harder to ignore. Here are three trades from our July journal that illustrate the principles in this article with uncomfortable clarity.
Case 1: The Perfect Setup That Lost (July 29, 14:35 ET)
Signal: SELL at $4,092. H1 showed a clear bearish CHoCH — price had broken below a swing low, retested it as resistance, and was beginning to roll over. RSI was at 62, coming off overbought. Volume on M5 was 1.3x the 20-period average. The setup was textbook. Every technical box was checked. A human trader reviewing this setup would have rated it an 8 or 9 out of 10.
The trade hit its stop loss ($4,102, -10 points) within 45 minutes. Price reversed, broke above resistance, and rallied to $4,130 by the session close.
What went wrong: H4 was in a strong bull trend. The EMA20 slope was +0.04% per period — the steepest bullish slope of the entire week. The bearish H1 CHoCH was a pullback within the trend, not a trend reversal. The sell signal was technically valid on H1 and below, but it was fighting the most powerful force in gold: the higher timeframe trend. The algorithm recorded this as a loss: -10 points, counter-H4, below the conviction threshold that would have filtered it out.
Lesson: A perfect setup on lower timeframes means nothing when H4 disagrees. The higher timeframe always wins — not sometimes, not usually. Always. If you disagree with H4, you're wrong until proven otherwise, and "proven" means H4 structure itself changes, not that your M15 setup looks pretty.
Case 2: The Ugly Trade That Won Big (July 30, 9:15 ET)
Signal: BUY at $4,045. This was the opposite of Case 1. The M15 setup was messy — price had been chopping for 90 minutes in a $12 range. No clean CHoCH. No obvious entry trigger. The M5 volume was average, not spiking. A human trader would have passed on this setup because it didn't look "clean." It looked like indecision.
But the algorithm's feature vector told a different story: H4 bullish with accelerating slope. H1 holding above EMA50 on the pullback. M15 forming higher lows within the chop — not a breakout, but compression suggesting a breakout was imminent. Three timeframes aligned on direction even though none of them individually showed an obvious entry. The gate filter passed: score 8, confidence 76%, entry allowed.
The trade hit its take profit ($4,072, +27 points) within 3 hours. The messy consolidation broke upward exactly as the compression pattern suggested.
Lesson: "Clean" setups are overrated. What matters is alignment — are the timeframes pointing the same way? A messy consolidation in an H4 trend is a coiled spring. A clean M15 reversal against the H4 trend is a trap. The human eye is drawn to the clean pattern. The algorithm is drawn to the alignment. The alignment wins.
Case 3: The Trap That Almost Worked (July 31, 11:42 ET)
This is the trade that never happened — and that's the point. Gold had been chopping between $4,065 and $4,085 all morning. At 11:42, price broke below $4,065 with a volume spike on M5. The break was clean. Support had "broken." A sell signal fired on the momentum module: SELL at $4,064.
The trap filter killed it. The level had been tested and held twice already in the session. The "breakdown" was the third test of support, and in gold, third tests on a range day are almost always traps — the institutions that defended support twice are still there, and they defend it a third time. Price reversed within 12 minutes, rocketed to $4,095, and the fake breakdown became a liquidity grab.
Lesson: The best trade is often the one you don't take. A prevented loss of 10-15 points is worth exactly as much as a 10-15 point gain, but it doesn't feel that way. You can't celebrate the money you didn't lose. The trap filter prevented this loss, and a human trader would have taken it — probably with conviction, because "support broke!" — and added another entry to the 94% column.
Trade With a System That Enforces the Protocol
Our algorithm runs all 7 gates before every signal — automatically. No emotion. No skipped steps. No "one more trade." Get real-time signals with the protocol built in.
Start Free Trial →
7 days free. All 7 gates active. Peak win rate: 87.5% (verified July 30, 2026).