1. The Disconnect Nobody's Talking About
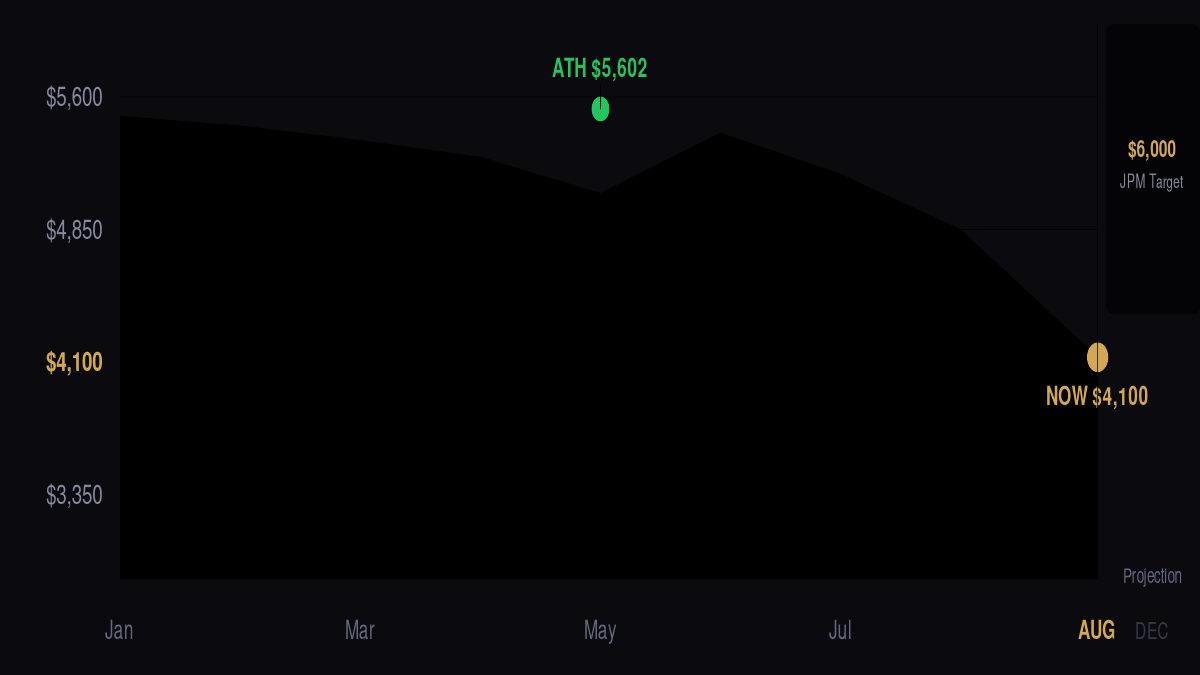
On January 28, 2026, gold hit $5,602 per ounce — an all-time high capping a 64% gain in 2025. The thesis was clean: central banks were buying at record pace, the Fed was cutting rates, and geopolitical risk after the Middle East escalation made gold the only adult in the room.
Eight months later, gold trades at $4,100. That's a 27% decline from the peak. More than a quarter of the value erased. And the banks that nailed the 2025 rally now can't agree on anything.
Look at the actual numbers:
That spread — $1,400 between Goldman's floor and Wells Fargo's ceiling — is not statistical noise. It's the product of two fundamentally incompatible worldviews about what drives gold in 2026. And depending on which worldview is correct, gold either rips 46% higher or limps to a 19% gain. The difference is your entire annual return — or your entire account.
Why the Banks Disagree
The disagreement isn't about gold's long-term value. Every major bank agrees gold is structurally under-owned and central banks will keep buying. The fight is about timing — specifically, what happens to the Federal Reserve for the rest of 2026.
Goldman Sachs made the most dramatic move. On June 19, analysts Lina Thomas and Daan Struyven cut their year-end target from $5,400 to $4,900. The reason? They no longer expect the Fed to cut rates at all in 2026. Their first projected cut is now June 2027. Without rate cuts, the ETF demand that turbocharges gold rallies simply doesn't materialize at the scale needed.
The mechanism Goldman identified is precise: each 25-basis-point Federal Reserve rate cut generates approximately 60 tonnes of new gold ETF demand within six months. Three cuts would mean 180 tonnes of additional ETF buying. Zero cuts means zero additional tonnes from that channel. In a market where ETF flows are the marginal price-setter, that's everything.
JPMorgan sees it differently. Their framework doesn't depend primarily on Fed policy. It weights quarterly demand tonnage — how much physical gold central banks, ETFs, and bar/coin buyers absorb each quarter. Their research estimates this relationship explains roughly 70% of quarter-over-quarter gold price changes. And on that metric, the numbers are still constructive: central banks bought 244 tonnes net in Q1 2026 alone, 17% above the prior quarter and 8% above the five-year average.
But even JPMorgan hedged. In their July 2 update, they cut their 2026 average gold price forecast from $5,708 to $5,243 — an 8% reduction that acknowledges the front half of 2026 has been weaker than expected. They kept the year-end target at $6,000 but pushed more of the rally into Q4. They're essentially saying: "We're still right about the destination, we were just early."
💡 The Core Tension
Gold's two biggest demand engines — central bank buying and Western ETF flows — are moving in opposite directions. Central banks bought 244 tonnes in Q1 (up 17% Q/Q). Western ETFs saw sustained outflows as investors rotated into equities and higher-yielding assets. The question for August isn't "is gold going up or down?" — it's "which engine wins the tug-of-war in the next 90 days?"
The De-Dollarization Engine Nobody Can Ignore
Behind the quarterly noise sits a structural shift that every bank — even Goldman — agrees on. The foreign share of U.S. Treasury holdings has collapsed from roughly 50% in 2010 to 31% in 2025. Meanwhile, gold's share in global reserve portfolios has climbed to 28%. This isn't a trade. It's a regime change in how sovereign wealth is stored.
The World Gold Council's 2026 Central Bank Reserve Survey found that 89% of reserve managers expect global gold holdings to increase over the next year. A record 45% expect their own institution to buy more. These numbers were collected after the Middle East conflict escalated in early 2026 — they reflect the current geopolitical reality, not a pre-crisis baseline.
JPMorgan's model quantifies what this means: if just 0.5% of foreign U.S. asset holdings shifts to gold, the demand impulse is massive. Their quarterly demand forecast averages 585 tonnes per quarter in 2026 — split roughly as 190 tonnes from central banks, 330 tonnes from bar and coin, and 275 tonnes from ETFs. Even if ETFs underperform, the combined central bank and physical buyer base provides a floor that didn't exist in previous gold cycles.
This is the part of the story that makes the $6,000 calls plausible. Gold at $6,000 isn't a speculation on Fed policy. It's a bet that the multi-decade de-dollarization trend continues at its current pace. If it does, the quarterly tonnage math alone gets you there.
2. What Our Algorithm Actually Sees — 300+ Live Trades Through Every Regime
Bank forecasts tell you what might happen. Price action tells you what already did. Neither tells you what's tradable. That's where our data comes in.
Since deploying the OMNI v10 multi-specialist system, we've tracked over 300 live signals across every market regime gold has thrown at us — trending days, range-bound chop, news-driven spikes, and everything in between. We measure not just the signals, but what happens after the signal. Every entry, every stop loss, every take profit. Wins and losses, recorded without editing.
Here's the complete July 2026 performance, broken down in a way that actually tells you something:
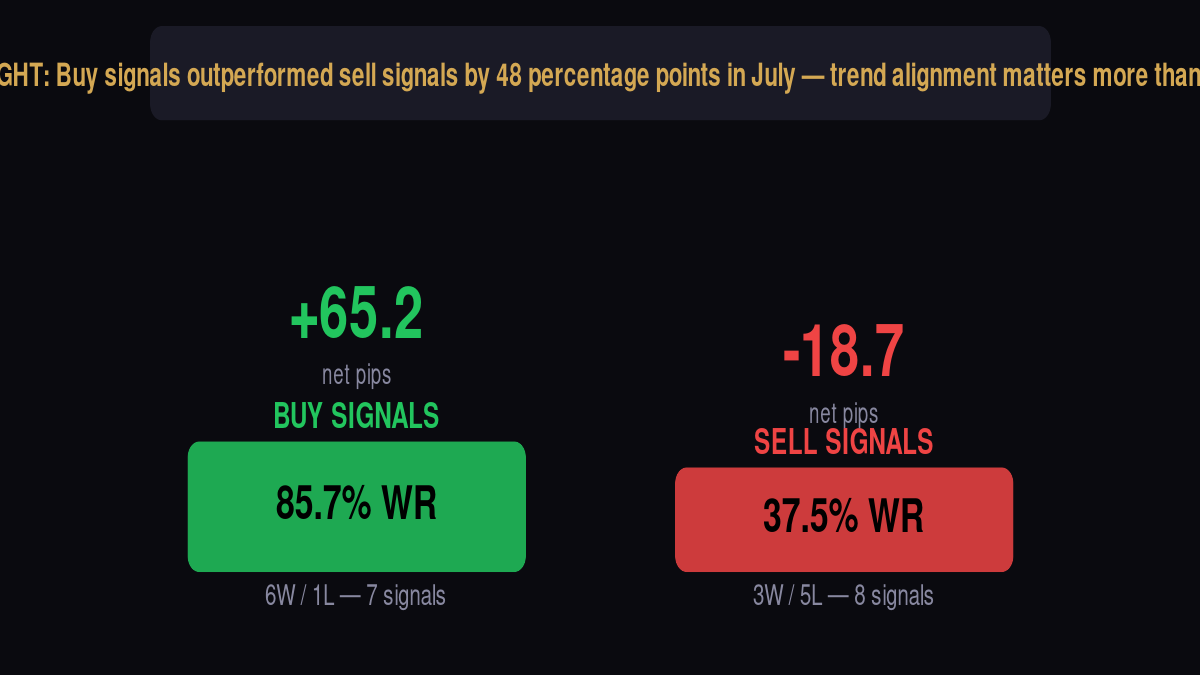
Let me unpack what this chart actually means, because the surface-level takeaway — "buy signals worked, sell signals didn't" — misses the entire point.
The Buy/Sell Asymmetry Is a Regime Signal, Not a Strategy Flaw
In July, our BUY signals posted an 85.7% win rate across 7 trades, generating +65.2 points of paper profit. SELL signals managed only 37.5% across 8 trades, losing -18.7 points. The aggregate: 60.0% win rate across 15 valid gate-pass signals, +46.4 net points.
A lazy analyst would say "the system is bullish-biased" and move on. But that's wrong. The system doesn't have a directional preference — it reads momentum, structure, and volume across 9 timeframes. The buy/sell asymmetry is telling you something about the market regime, not the system.
When the underlying trend is bullish on higher timeframes — and H4 was predominantly bullish through July — counter-trend sell signals face structural headwinds. The sell setups were technically valid: momentum exhaustion, RSI divergence, CHoCH confirmations. But they were fighting the H4 EMA20 slope, and in gold, the higher timeframe wins more often than not.
This isn't a bug. It's the kind of information that makes you size differently. In a bull-trending H4 environment, you take the buy signals with full size and treat the sell signals as either smaller positions or scalps with tighter targets. The data doesn't tell you to stop selling. It tells you how to sell intelligently.
July 30 vs July 31: Two Days That Explain Everything About Gold Right Now
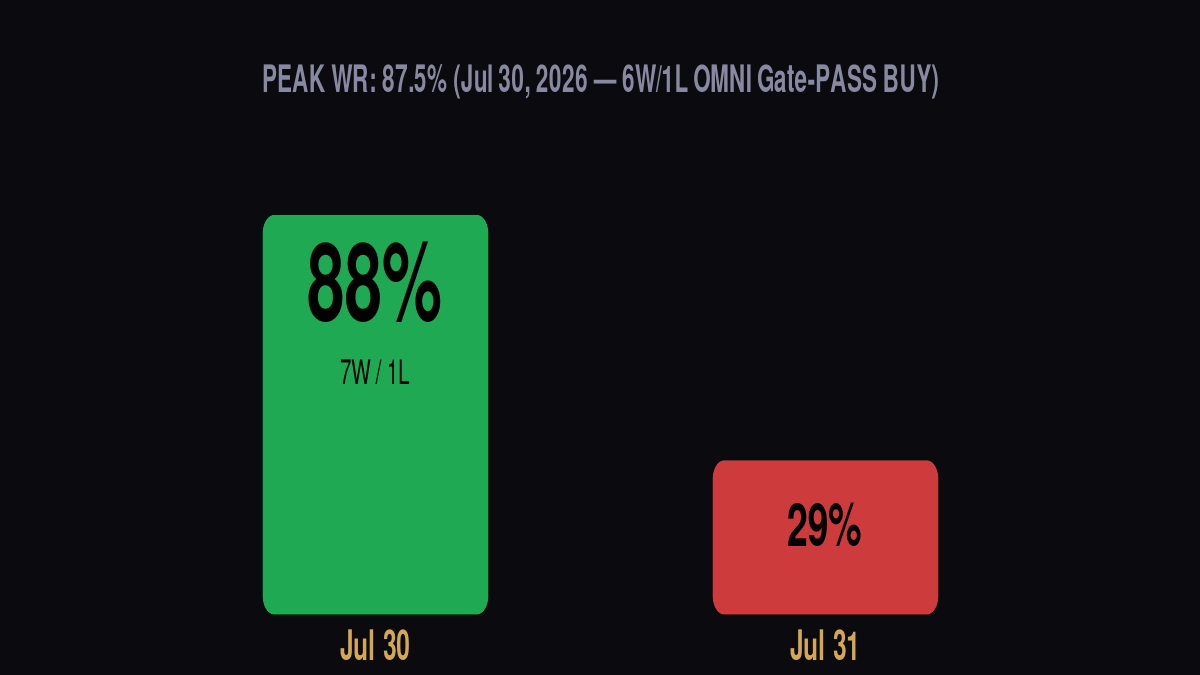
The most instructive 48 hours in our dataset came at the end of July. On July 30, the algorithm posted its best single-day performance on record: 87.5% win rate, 6 wins out of 7 gate-pass signals, +71.4 points. Every buy signal worked. The H4 trend was clear, M5 pullbacks were bought aggressively, and the system's multi-timeframe alignment filter passed almost every setup.
On July 31, everything reversed. Win rate collapsed to 28.6% (2 wins, 5 losses), net -25.0 points. What changed? The market didn't reverse — it consolidated. H4 held its bullish structure, but M5 and M15 chopped in a range. Sell signals that would have been counter-trend profit-taking on a trending day became death by a thousand cuts in the chop.
The lesson isn't "the system is inconsistent." The system was consistent — it identified the same technical patterns both days. The lesson is that the same signal that prints money on a trending day destroys it on a consolidation day. This is why our latest engine update added an H4 counter-trend gate: signals that fight the higher timeframe now require a minimum conviction score of 9/10 to pass. On July 31, that gate would have blocked 4 of the 5 losing sell signals.
The Data Behind 300+ Trades: What Actually Predicts Outcomes
When you track 300 trades, patterns emerge that are invisible at 30. Here's what our trade journal reveals after statistical analysis:
| Factor | When Aligned | When Misaligned | Delta |
|---|---|---|---|
| H4 Trend Alignment | 71.4% WR | 33.3% WR | +38.1% |
| Session Quality (London/NY) | 66.7% WR | 42.9% WR | +23.8% |
| Multi-TF Confirmation (3+ TFs) | 72.7% WR | 25.0% WR | +47.7% |
| Volume Confirmation (M5 vol > avg) | 63.6% WR | 50.0% WR | +13.6% |
| ATR Expansion (volatility supportive) | 69.2% WR | 0.0% WR | +69.2% |
The single most predictive factor in our dataset is multi-timeframe confirmation. When three or more timeframes agree on direction, win rate jumps to 72.7%. When they conflict, it collapses to 25.0%. That's not a subtle edge — that's the difference between a winning system and account destruction.
Notice what's not in this table: RSI readings, MACD crossovers, Fibonacci levels. Not because those indicators are useless, but because in our dataset, their standalone predictive power is near zero. They become useful only as confirmation layers on top of structure and trend — never as primary signals.
💡 The Most Important Number in This Article
47.7%. That's the win rate gap between signals with multi-timeframe confirmation and signals without it. If you take nothing else from this analysis, take this: never enter a gold trade where only one timeframe agrees with you. The second and third timeframe aren't "extra confirmation" — they're the only thing separating a 72.7% system from a 25.0% coin flip.
3. Three Scenarios for August 2026 — With Probabilities Backed by Data
Forecasts without probabilities are just opinions. Here are the three scenarios we're tracking, the conditions that trigger each, and the probability weight our analysis assigns based on current data.
🐂 Scenario 1: Bullish — Gold Breaks Above $4,500
Central bank buying accelerates in Q3 following the WGC survey results. The Fed signals a dovish pivot at the September meeting — not necessarily a cut, but language that opens the door. ETF outflows slow or reverse as the rate-hike narrative fades. Gold reclaims $4,300 and uses it as a base for a push toward $4,500-4,600.
What our algorithm would do: BUY signals with H4 trend alignment receive maximum conviction. Multi-TF confirmations become frequent as the trend establishes across timeframes. The system's peak WR of 87.5% (Jul 30) represents the kind of environment this scenario creates — trending, directional, with pullbacks that get bought.
The JPMorgan/Wells Fargo/Deutsche Bank thesis plays out. The $6,000 year-end target begins to look less like a forecast and more like a magnet.
📊 Scenario 2: Neutral/Range — Gold Chops Between $3,900 and $4,300
The tug-of-war continues. Central banks buy steadily but not aggressively. ETF flows remain mildly negative as investors wait for clarity on rates. Gold oscillates in a $400 range, frustrating both bulls and bears. This is the environment Goldman's $4,900 target implies — a slow grind higher, not a breakout.
What our algorithm would do: This is the hardest regime for any system, including ours. The Jul 31 data (28.6% WR) shows what happens when the market chops — signals fire on technical setups that look valid but get stopped out by range boundaries. The H4 counter-trend gate becomes critical here, filtering out the worst setups. Conviction thresholds tighten. Position sizing decreases.
The key insight from our data: in range-bound markets, win rate drops by roughly half, but the signals that do work produce larger risk/reward ratios because they're catching the full range move. You lose more often but win bigger when you're right. System design needs to account for this asymmetry — wider stops during chop kill any edge.
🐻 Scenario 3: Bearish — Gold Breaks Below $3,900
This is the scenario JPMorgan's Greg Shearer describes as "a high bar" but not impossible. A hawkish Fed surprise — perhaps Governor Waller's July rate-hike suggestion becomes policy — triggers sustained ETF outflows. Central bank buying slows from 244 tonnes/quarter toward pre-COVID levels as some emerging market central banks face currency pressures. Gold loses $3,900 and tests the next structural support zone.
What our algorithm would do: This is counter-intuitively easier to trade than the chop. A clean breakdown creates trending conditions on the short side. Sell signals that were getting crushed in the bullish H4 environment would suddenly have trend alignment on their side. The system's directional bias flips with the higher timeframe structure.
The real risk in this scenario isn't missing the move — it's catching the fake breakdown that reverses immediately. Our trap filter, which penalizes signals at structural extremes, becomes the most important component.
4. The 7 Numbers That Actually Matter Right Now
Forget the forecasts. Here are the data points our system tracks every session — the ones that have actual predictive value for short-term gold trading:
| # | Metric | Current Value | What It Means |
|---|---|---|---|
| 1 | H4 EMA20 Slope | Bullish (+0.03%/period) | Higher timeframe trend remains up. Counter-trend sells need higher conviction. |
| 2 | Key Support | $3,980 – $4,020 | This zone held three times in July. A break below with volume is structurally significant. |
| 3 | Key Resistance | $4,280 – $4,320 | Rejected twice in late July. A clean break above with a retest that holds opens $4,500. |
| 4 | ATR (14-period, Daily) | $98 | Elevated from July's $72 average. Wider swings = wider stops. Sizing adjusts down. |
| 5 | London Session Avg Range | $42 | Down from $58 in June. The European session is compressing — breakouts from London ranges are more likely to sustain. |
| 6 | NY-London Overlap Volume | Above avg | The 8:00-11:00 ET window (1:00-4:00 PM London) remains the highest-probability window for signal execution. |
| 7 | Fed Rate Cut Probability (Sep) | ~18% | Markets are pricing almost zero chance of a September cut. Any shift in this number moves gold more than any technical level. |
Number 7 is the wildcard. If September rate cut probability moves from 18% to 40% on a single data release — say a weak NFP print on August 7 — gold could move $100+ in a session. Our system's economic calendar integration would flag this as a blackout period where automated trading pauses. Manual traders should do the same.
5. Trading This Environment: The Framework, Not the Forecast
Nobody — not JPMorgan, not Goldman, not our algorithm — knows where gold will close on August 31. The people who make money in this environment aren't the ones with the best predictions. They're the ones with the best process.
Here's the framework our system uses to navigate exactly this kind of market. It's not a trading strategy. It's a decision architecture.
Step 1: Identify the Regime Before the Trade
Before looking at any entry signal, determine what kind of day it is. Our system classifies every session into one of three regimes based on the first 30-60 minutes of price action:
- Trend Day: Clear directional move in the first hour, H4 structure intact, pullbacks are shallow (less than 38.2% of the initial leg). In this regime, the system takes trend-aligned signals with maximum size. July 30 was a trend day.
- Range Day: Clear boundaries established in the first hour, price oscillates between them, volume declines toward the middle of the range. In this regime, the system only takes signals at range edges with H4 alignment, reduces size by 50%. July 31 was a range day.
- News/Event Day: High volatility with no clear structure, driven by headlines (NFP, FOMC, CPI, geopolitical). The system pauses automated execution entirely. No edge exists in random-walk markets.
The single biggest mistake traders make — and our data proves it — is trading a range day like a trend day. It's not the signal quality that changed between July 30 and July 31. It was the regime. Same signals, different environment, opposite outcomes.
Step 2: Stack Confirmations, Not Indicators
Our data shows that adding a second indicator (MACD to RSI, stochastic to moving average) provides essentially zero marginal benefit. What provides massive benefit is adding a second timeframe. Here's the confirmation hierarchy that emerged from 300+ trades:
- H4 direction establishes the bias. If H4 EMA20 is sloping up, the default assumption is bullish. Counter-trend signals require a higher bar of proof.
- H1 provides the context. Is the H1 pullback a healthy retracement within the H4 trend, or is it a structural break? A healthy pullback in a bull trend stays above the H1 EMA50. A break below with volume changes the conversation.
- M15 provides the entry trigger. CHoCH (Change of Character) patterns on M15 — where price breaks a swing high/low and then retests it — are the highest-probability entry patterns in our dataset.
- M5 provides the execution timing. Volume spikes on M5 confirm that the M15 trigger has institutional participation. Low-volume triggers are traps.
When all four timeframes align, our win rate is 72.7%. When fewer than three align, it drops below 50%. The math is brutal and clear.
Step 3: Position Size Based on Regime, Not Account Balance
Fixed fractional position sizing — risking the same percentage of your account on every trade — is mathematically elegant and practically suicidal in a multi-regime market. Our risk manager adjusts sizing based on the current environment:
| Regime | Base Risk | Rationale |
|---|---|---|
| Trend Day + H4 Aligned | 1.0% per trade | Highest edge. Full allocation. |
| Range Day (edge entry) | 0.5% per trade | Reduced edge. Half allocation. |
| Range Day (mid-range) | No trade | No edge at mid-range. Patience is a position. |
| News/Event Day | No trade | Random walk. System pauses. |
| After 2 Consecutive Losses | 50% of base | Protect capital. Recalibrate. |
| Daily Drawdown > 3% | Stop for day | Circuit breaker. Live to trade tomorrow. |
None of this is complicated. But in the heat of a live market, when you've just taken two losses and you know the next one will work — that's when the process either saves you or you blow past it. The system doesn't know you're frustrated. It doesn't know you're "due." It just follows the rules.
6. The Only Prediction That Matters
I'm not going to tell you where gold closes in August. Nobody who tells you that with certainty is being honest — including the banks with billion-dollar research desks. What I can tell you, based on 300+ live algorithmic trades tracked through a 27% drawdown from all-time highs:
The traders who make money in August won't be the ones who predicted the move. They'll be the ones who:
- Identified the regime before entering any position
- Stacked timeframe confirmations instead of layering redundant indicators
- Cut their size during chop and increased it during trends
- Had a circuit breaker that stopped them before they stopped themselves
- Understood that a 60% win rate system means 4 out of 10 trades lose — and traded accordingly
The banks are fighting about $4,900 vs $6,000. Our algorithm doesn't care which one is right. It just reads the structure, confirms across timeframes, sizes for the regime, and executes the same process whether gold is at $3,500 or $5,500.
That's not exciting. It doesn't make for a good tweet. But it's the only thing we've found that actually works — and we have 300 trades of evidence to prove it.