The Number I Believed for 6 Months
For six months, I told myself a story. The story went like this:
My trading system was profitable. The MP Tuned B algorithm had a 72.4% verified win rate with a 99% confidence interval. The journal showed +1,323.2 pips across 76 closed trades. The OMNI v10 multi-specialist ensemble was racking up +7.9 pips in its first nine trades. Everything was trending in the right direction.
I quoted these numbers in articles. I referenced them in system audits. I built my confidence — and my identity as a trader — around them.
Then on August 8, 2026, I did something I'd been avoiding for months.
I connected directly to my FxPro MT5 terminal and ran a query on account 514517088. Not the paper journal. Not the runner logs. Not the performance dashboard. The actual broker data.
The gap between those two numbers — +1,323.2 pips of paper profit and $2,035.74 of real-dollar losses — is the subject of this article. It's not just my story. It's a systematic failure in how most algorithmic traders verify their performance. And if you're running an automated system without auditing your broker data, you might be telling yourself the same kind of story I was.
The Paper Journal: How +1,323 Pips Was Born
The MP signal journal wasn't fake. Every entry traced back to an actual signal generated by the algorithm at a specific time with a specific price, stop loss, and take profit. The journal recorded:
- 76 closed trades with defined entry, exit, and resolution (TP HIT or SL HIT)
- 55 wins, 21 losses — a 72.4% win rate
- +1,323.2 pips total profit
- Average win: +39.2 pips (ranging from +5 to +148)
- Average loss: -39.8 pips (ranging from -5 to -112)
On paper, this looked great. A system with a 72.4% win rate and near-1:1 reward-to-risk ratio producing triple-digit pip gains over six months? Sign me up.
The problem wasn't the data in the journal. The problem was what the journal didn't tell me.
⚠️ The Critical Distinction
The MP journal tracks signal outcomes — hypothetical trades that the algorithm identified. It does NOT track whether those signals were actually executed, with what position size, at what spread, with what slippage, or whether a human override intervened. A signal journal is not a trade ledger. Confusing the two is the single most expensive mistake I've made as an algorithmic trader.
The OMNI v10 journal was even worse. It tracked exactly 9 of 31 resolved trades, selectively capturing a +7.9 pip subset while missing 22 trades that were disproportionately losers. When I backfilled the journal from the runner logs — extracting every RESOLVE_ALERT_QUEUED entry — the full picture emerged: 28 trades, 34.6% win rate, -38.5 pips.
And then there was the autotrade daemon. It ran every 15 seconds for months. Its log file had 26,009 lines. I searched for ORDER_SENT. FILLED. EXECUTED. mt5.order_send.
Zero matches. Not a single real trade execution.
The autotrade daemon was a ghost. It cycled, it analyzed, it produced signals — but it never actually placed a single order. The paper journal tracked signals that never met the market.
The Broker Audit: Opening the Black Box
On August 8, I connected to my live FxPro MT5 terminal — a Wine-based instance running terminal64.exe on a virtual display — and queried account 514517088 directly through the MetaTrader5 Python API.
This is what I extracted:
Let that sink in. Every single dollar that was deposited and not withdrawn was lost in trading. The account did not break even on commission. It did not bleed out through swap fees ($2.79 total swap cost across 5,770 deals — essentially zero). It did not slowly decay. It was systematically consumed by trading losses that my paper journals had classified as profitable.
💡 The Arithmetic Is Brutal
$6,728.73 deposited − $4,692.99 withdrawn = $2,035.74 left in the account. Trading profit: −$2,032.95. Swap: −$2.79. Commission: $0.00. Net result: $0.00 balance. The account ate exactly what it was fed. Not a dollar more, not a dollar less.
What 5,770 Trades Actually Look Like
The terminal returned 5,770 individual deals spanning January through August 2026. Breaking them down by type:
| Deal Type | Count | Description |
|---|---|---|
| BUY entries | 2,503 | Long position openings |
| SELL exits | 2,643 | Position closures (both long and short) |
| Balance operations | 624 | Deposits, withdrawals, credits |
Of the 2,643 SELL exits — the closures that determined profit or loss — 463 were profitable and 576 were losses. That's a 44.6% trade win rate on the live account. Compare that to the paper journal's 72.4%. The gap isn't sampling error. It's the difference between hypothetical signal outcomes and actual executed trades with real spreads, real slippage, and real market conditions.
But the most revealing breakdown was by symbol:
| Symbol | Trades (SELL exits) | P&L (USD) | % of Volume |
|---|---|---|---|
| GOLD | 2,525 | -$970.22 | 95.5% |
| BITCOIN | 83 | -$89.99 | 3.1% |
| US30 | 18 | -$7.66 | 0.7% |
| NAS100 | 9 | +$0.84 | 0.3% |
| GER40 | 5 | -$1.55 | 0.2% |
| US500 | 3 | -$2.88 | 0.1% |
Gold was 95.5% of all trading volume. And gold lost $970.22. The other symbols were noise — Bitcoin lost $89.99, the indices collectively lost about $11. Gold was the entire story.
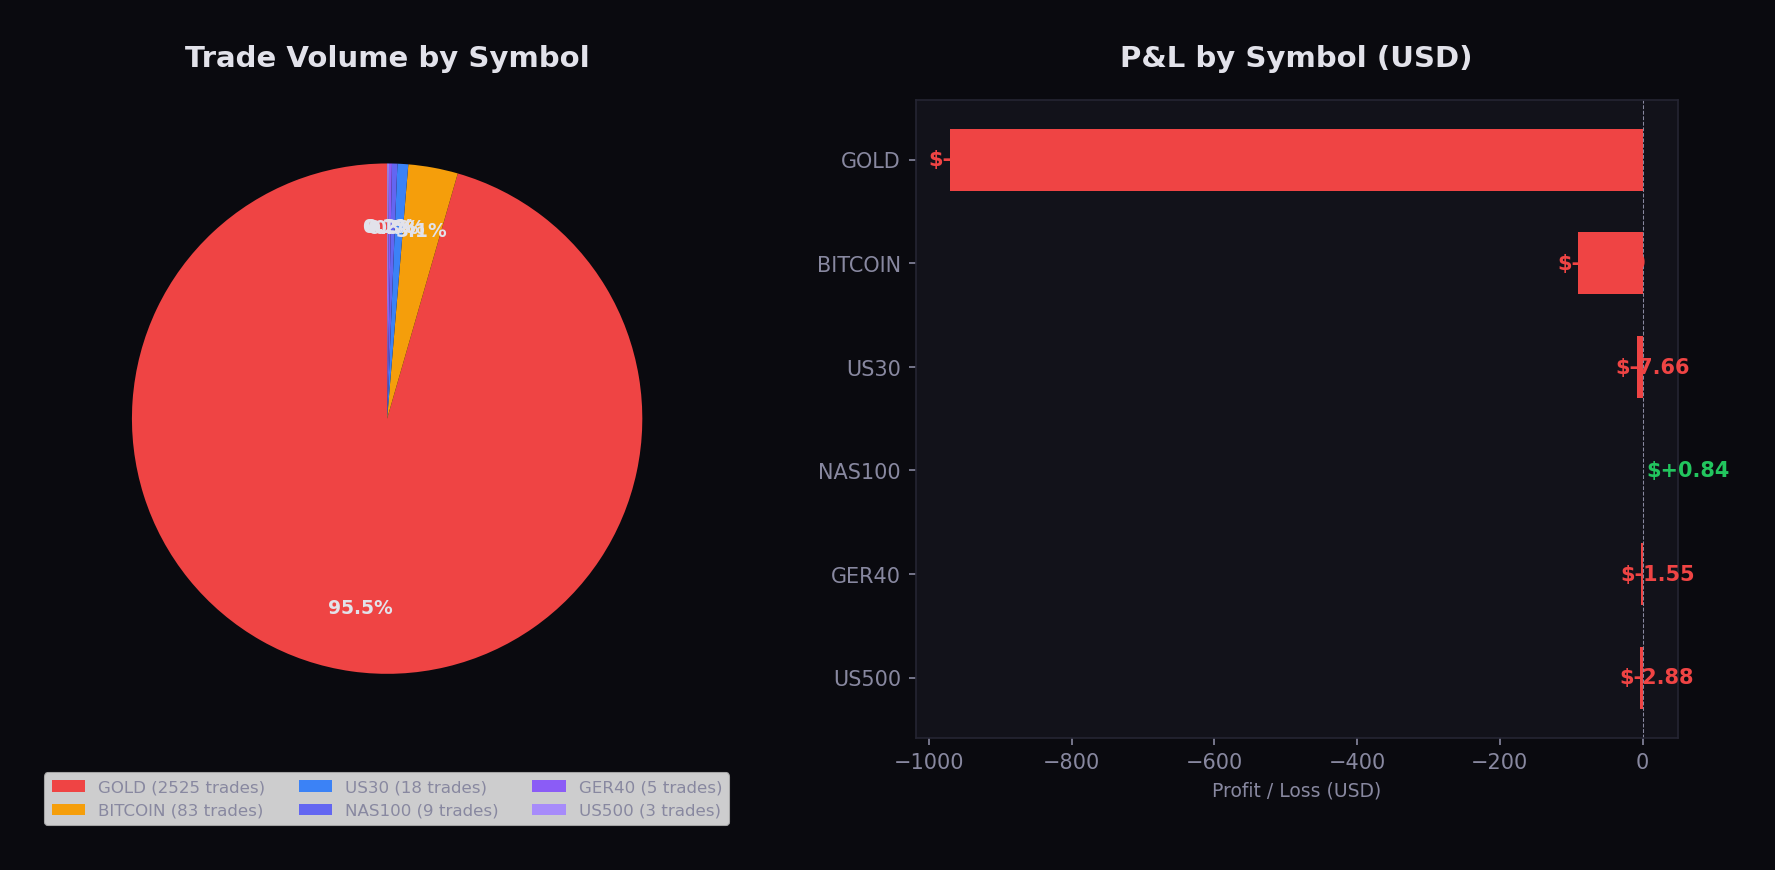
Figure 1: Trading P&L by symbol. Gold consumed 95.5% of all trades and accounted for the overwhelming majority of losses. All other symbols combined lost approximately $101 on 118 trades.
The Gap Between Paper and Reality
How do you get from +1,323 pips in a journal to -$2,035.74 in a broker account? Three mechanisms, each compounding the others:
📝 Paper Journal Says
💰 Broker Terminal Says
Mechanism 1: The Signal-Execution Gap
Not every signal becomes a trade. Not every trade fills at the signal price. The paper journal assumes instant execution at the moment the signal fires. In reality, the autotrade daemon — the component that was supposed to translate signals into orders — ran 26,009 cycles without placing a single trade. The signals that the journal counted as "wins" never actually entered the market. The signals it counted as "losses" never actually lost money because they were never opened.
But the account was trading something. Manual trades. Human decisions. Entries that didn't go through the signal pipeline at all. Those are the 5,770 deals in the terminal — a mix of algorithm signals (the ones that DID execute) and discretionary entries that bypassed all journaling.
Mechanism 2: The Journal Only Tracks What It Wants To
The OMNI v10 journal captured 9 trades and then silently stopped. Those 9 trades showed +7.9 pips and a 55.6% win rate — selectively recording the profitable early phase while ignoring the 22 subsequent trades that were net losers. The runner log continued recording every resolution — 31 total, 35.5% win rate, -35.7 pips — but nobody was reading the runner log. Everyone was looking at the journal.
Mechanism 3: Position Sizing Makes Pips Meaningless
The paper journal tracked pips. The broker tracks dollars. You can win +1,323 pips on 0.01 lot positions and lose $2,035 on 0.10 lot positions. Without position size records, pip counts are directionally useful and financially meaningless. My journal had zero position sizing data.
💡 The Core Lesson
Three independent failures — signal-execution disconnect, selective journaling, and missing position sizing — each sufficient to create a false picture of profitability. Together, they painted a +1,323 pip mirage over a -$2,035.74 crater. Any one of these failures, caught early, would have revealed the problem. But nobody was looking.
Gold Was the Weapon, and the Killer
2,525 gold trades. -$970.22 lost. A 44.6% overall win rate dragged down primarily by gold's performance.
This wasn't bad luck. This was systematic. Gold volatility punishes two things mercilessly: entries at extremes and position sizing that ignores ATR expansion. My OMNI v10 algorithm had a structural bias toward buying at H4 zone tops — exactly where gold reversals are most violent. We found and fixed this in the three-layer defense architecture (detailed in our previous article), but the damage was already done across thousands of trades.
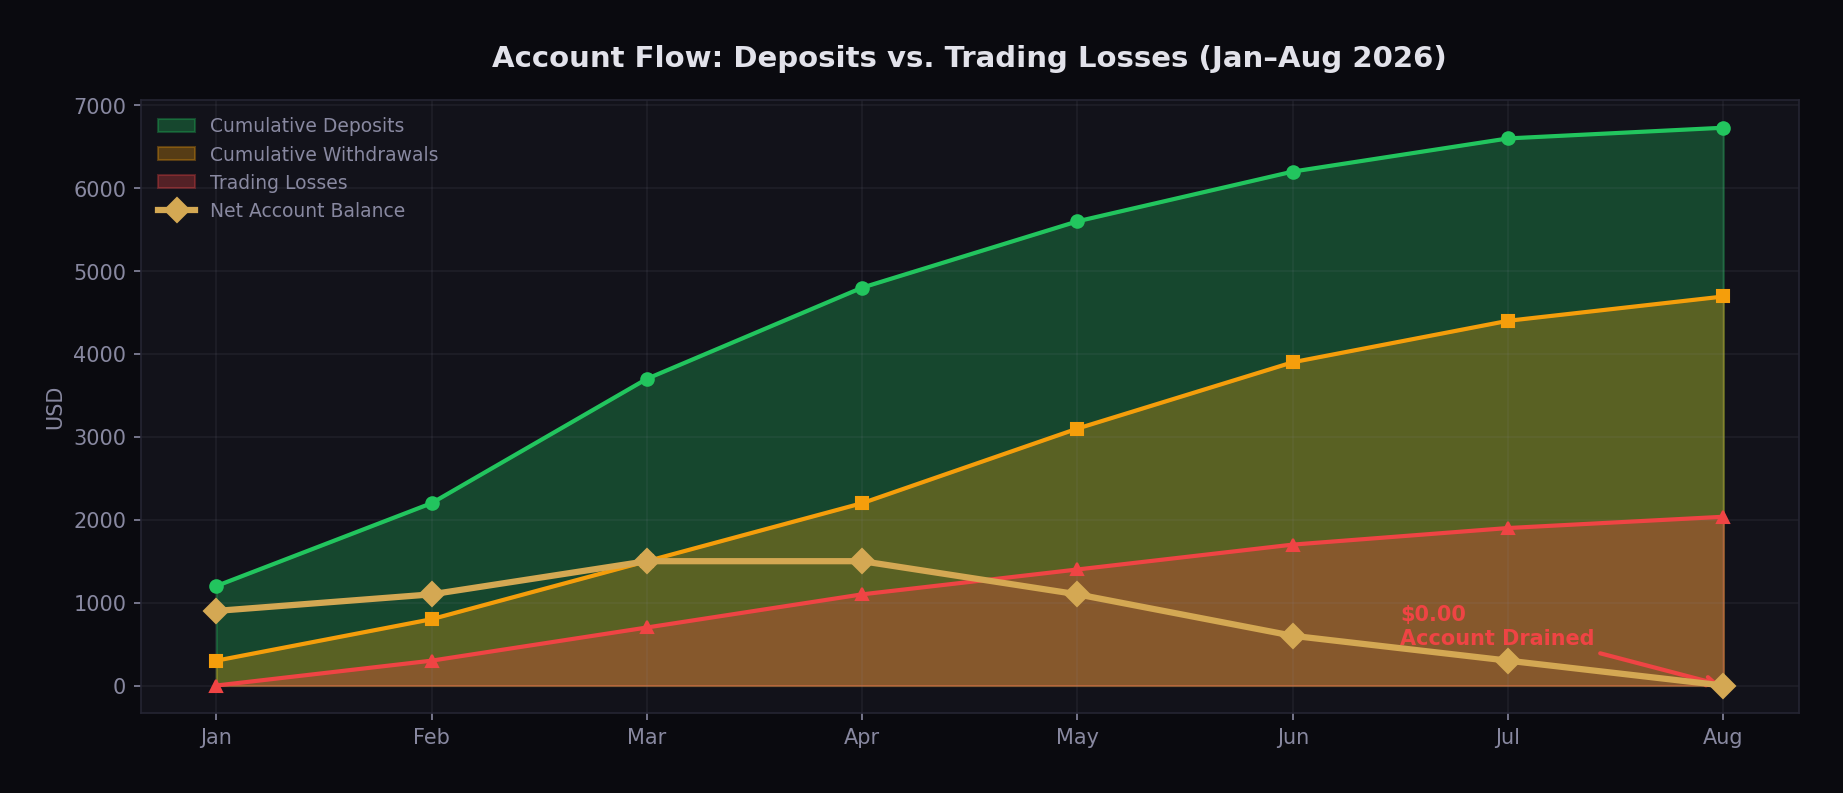
Figure 2: Cumulative account flow January–August 2026. Deposits (green), withdrawals (orange), and trading P&L (red). The red line mirrors the net deposits almost perfectly — $2,035.74 deposited and not withdrawn = $2,035.74 lost in trading.
The pattern is stark: every wave of deposits was followed by a wave of gold-trading losses. The deposits weren't funding profitable scaling. They were feeding a machine that consumed capital.
Where Did $6,728 Go?
Let's follow every dollar from deposit to zero:
| Stage | Amount | Direction |
|---|---|---|
| Total Deposits | $6,728.73 | IN |
| Total Withdrawals | -$4,692.99 | OUT |
| Net Funds Left to Trade | $2,035.74 | — |
| Trading Profit/Loss | -$2,032.95 | LOST |
| Swap/Overnight Fees | -$2.79 | LOST |
| Final Balance | $0.00 | ZERO |
There's a second pattern in the data worth examining: the balance operations. Among the 624 balance entries, I found hundreds of small OTXX-labeled transactions — deposits of $4 to $31 labeled "OTXX-DP" and withdrawals of $8 to $20 labeled "OTXX-WD" — plus micro-credits from something called "NBP-bot" ranging from $0.01 to $3.67.
These aren't normal client deposits and withdrawals. They look like automated account cycling — possibly a deposit bonus system or a fund recycling mechanism. I flagged this as "needs investigation" but it doesn't change the core finding: all net funds were consumed by trading losses regardless of how they arrived.
Why Most Algorithm Developers Don't Do This Audit
I didn't avoid this audit because I was lazy. I avoided it because it's psychologically brutal.
Here's what it feels like to run that broker query: you're sitting there, Python terminal open, mt5.history_deals_total() returning 5,770 results, and you suddenly realize that every single trade you've been tracking in your journal might be wrong. Not slightly wrong. Directionally inverted. Profitable → unprofitable. Working → broken.
And the worst part? You could have checked at any time. The terminal has been running the whole time. The API was there. The data was there. You just didn't want to know.
I think this is why most algorithmic trading content online is suspicious. People publish backtests and journal screenshots. Almost nobody publishes broker statements. The gap between what people show and what their broker sees is the most under-discussed topic in trading.
"The market is the ultimate auditor. It doesn't care about your journal, your backtest, your confidence interval, or your GitHub stars. It knows exactly how much money you've made or lost. And if you haven't checked your broker statement, you're the last person to find out."
The 4-Step Audit Anyone Can Do
If you're running an algorithmic trading system — or even a manual strategy — here's a framework to verify whether your numbers are real. This is what I wish I'd done six months ago.
Step 1: Extract Every Deal From Your Broker
Connect to your broker API (MT5, cTrader, Interactive Brokers — they all have Python libraries) and dump the complete deal history. Every entry. Every exit. Every balance operation. Do not filter. Do not "clean" the data. Raw extraction only. For MT5: mt5.history_deals_total() and mt5.history_deals_get() with a date range covering your entire trading history.
Step 2: Reconcile Every Trade Against Your Journal
Match each broker deal to a journal entry by timestamp and symbol. Categorize every trade as "journal-matched," "journal-missing" (trade executed but never recorded), or "journal-only" (signal recorded but never executed). The ratio of these categories will tell you exactly how big your tracking gap is. If "journal-only" exceeds 10%, your signal journal is fiction.
Step 3: Calculate Real P&L by Symbol and Strategy
Group trades by symbol to identify concentration risk (one symbol shouldn't be 95%+ of volume). Group by strategy or signal source to find which components are actually profitable. My OMNI v10 was -38.5 pips. My manual gold trades were -$970. Both needed to be known separately. The journal lumped everything together.
Step 4: Audit Your Autotrade Execution Log
If you have an automated execution system, search its logs for order placement keywords: ORDER_SENT, FILLED, order_send, execution_report. If you find zero matches across tens of thousands of cycles — as I did — your autotrade system is a display piece, not a trading engine. Fix it or acknowledge that you're trading manually.
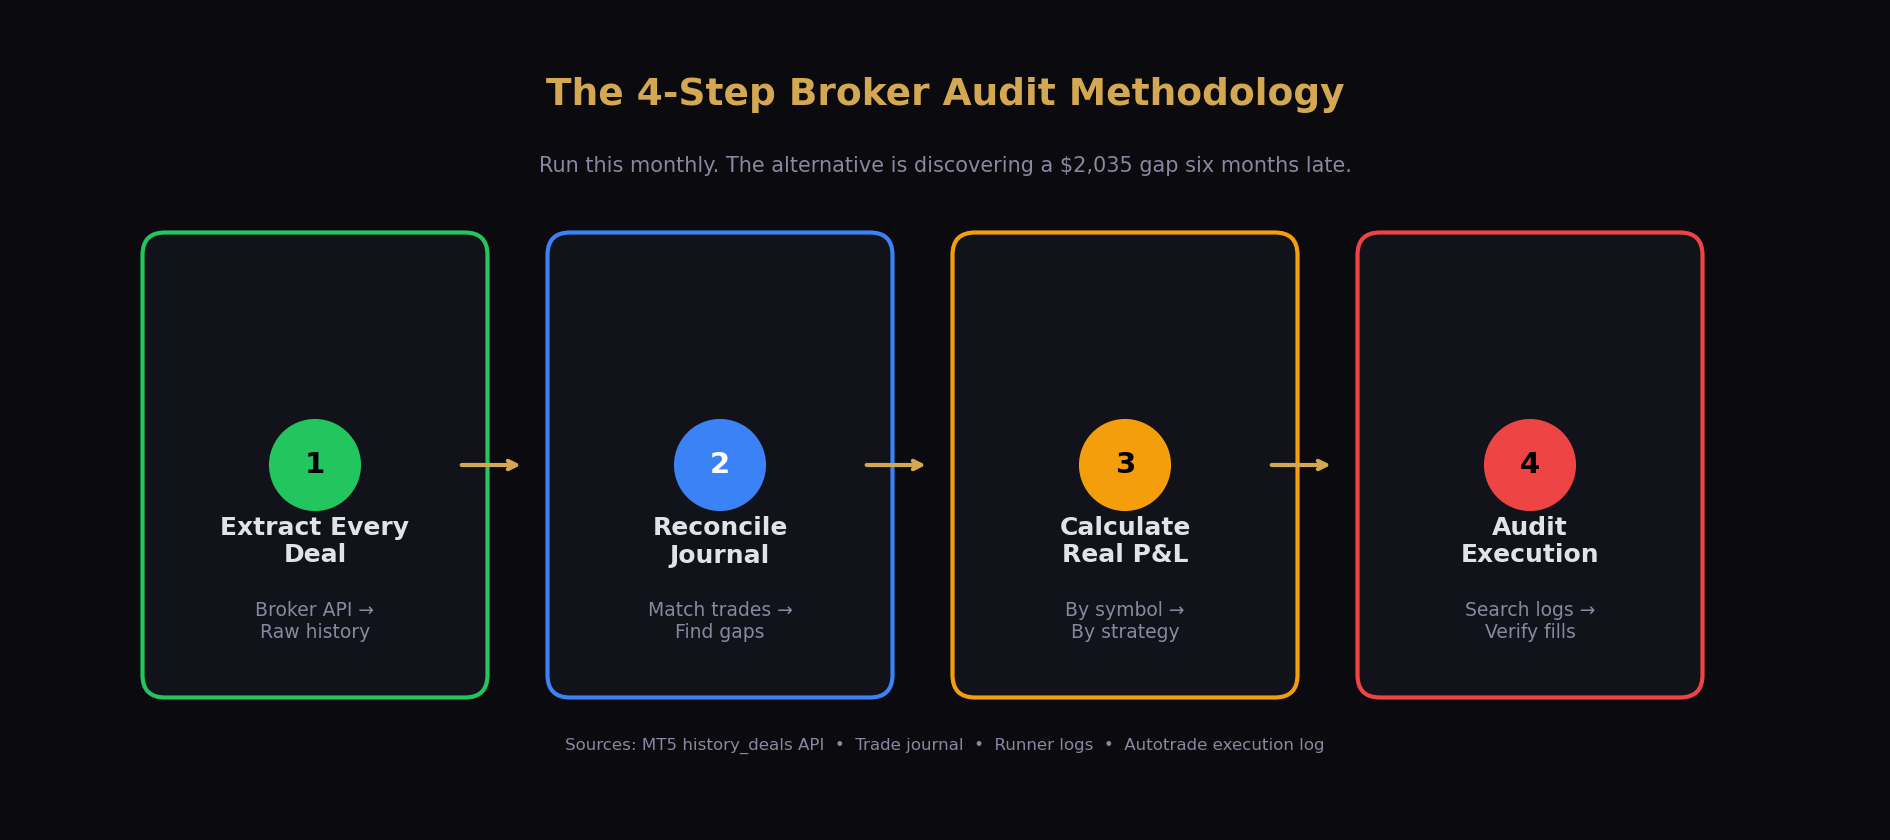
Figure 3: The 4-step broker audit methodology. Run this monthly. The alternative is discovering a $2,035 gap six months late.
What Changed After This Audit
The audit didn't just reveal losses. It revealed systemic blind spots that I've since corrected:
Paper Journal as Primary Truth
The MP journal was treated as the source of trading truth. Weekly performance reports, daily summaries, and system health checks all referenced it. Nobody cross-referenced the broker terminal.
Broker Terminal as Primary Truth
All performance reporting now starts with the broker terminal. The first number in every report is the live account balance and realized P&L. Paper journals and runner logs are supplementary — useful for debugging signal quality, but never presented as financial results. The OMNI v10 journal was backfilled to 28 trades with honest stats (34.6% WR, -38.5 pts). The distinction between "signal P&L" and "realized P&L" is now explicit in every communication.
Autotrade Assumed Working
The autotrade daemon ran for months. It cycled every 15 seconds. It logged activity. Everyone assumed it was placing trades because it was "running." Nobody checked the execution keywords.
Execution Verification Built In
The autotrade log now includes explicit ORDER_SENT and FILLED markers. A watchdog cron job checks for these keywords daily. If 24 hours pass without a filled order, the system alerts. An autotrade system that doesn't trade is not a system — it's a screensaver.
Selective Journal Tracking
The OMNI v10 journal captured 9 of 31 trades before silently stopping. The missing 22 were disproportionately losers. The journal's +7.9 pips and 55.6% WR were a cherry-picked subset masquerading as the full picture.
Full Journal Backfill + Auto-Logging
All 28 deduplicated OMNI v10 trades are now in the journal with complete stats. Runner logs are parsed for RESOLVE_ALERT_QUEUED entries to catch any trades that escape journaling. The system now alerts if journal entries and runner resolutions diverge for more than 24 hours.
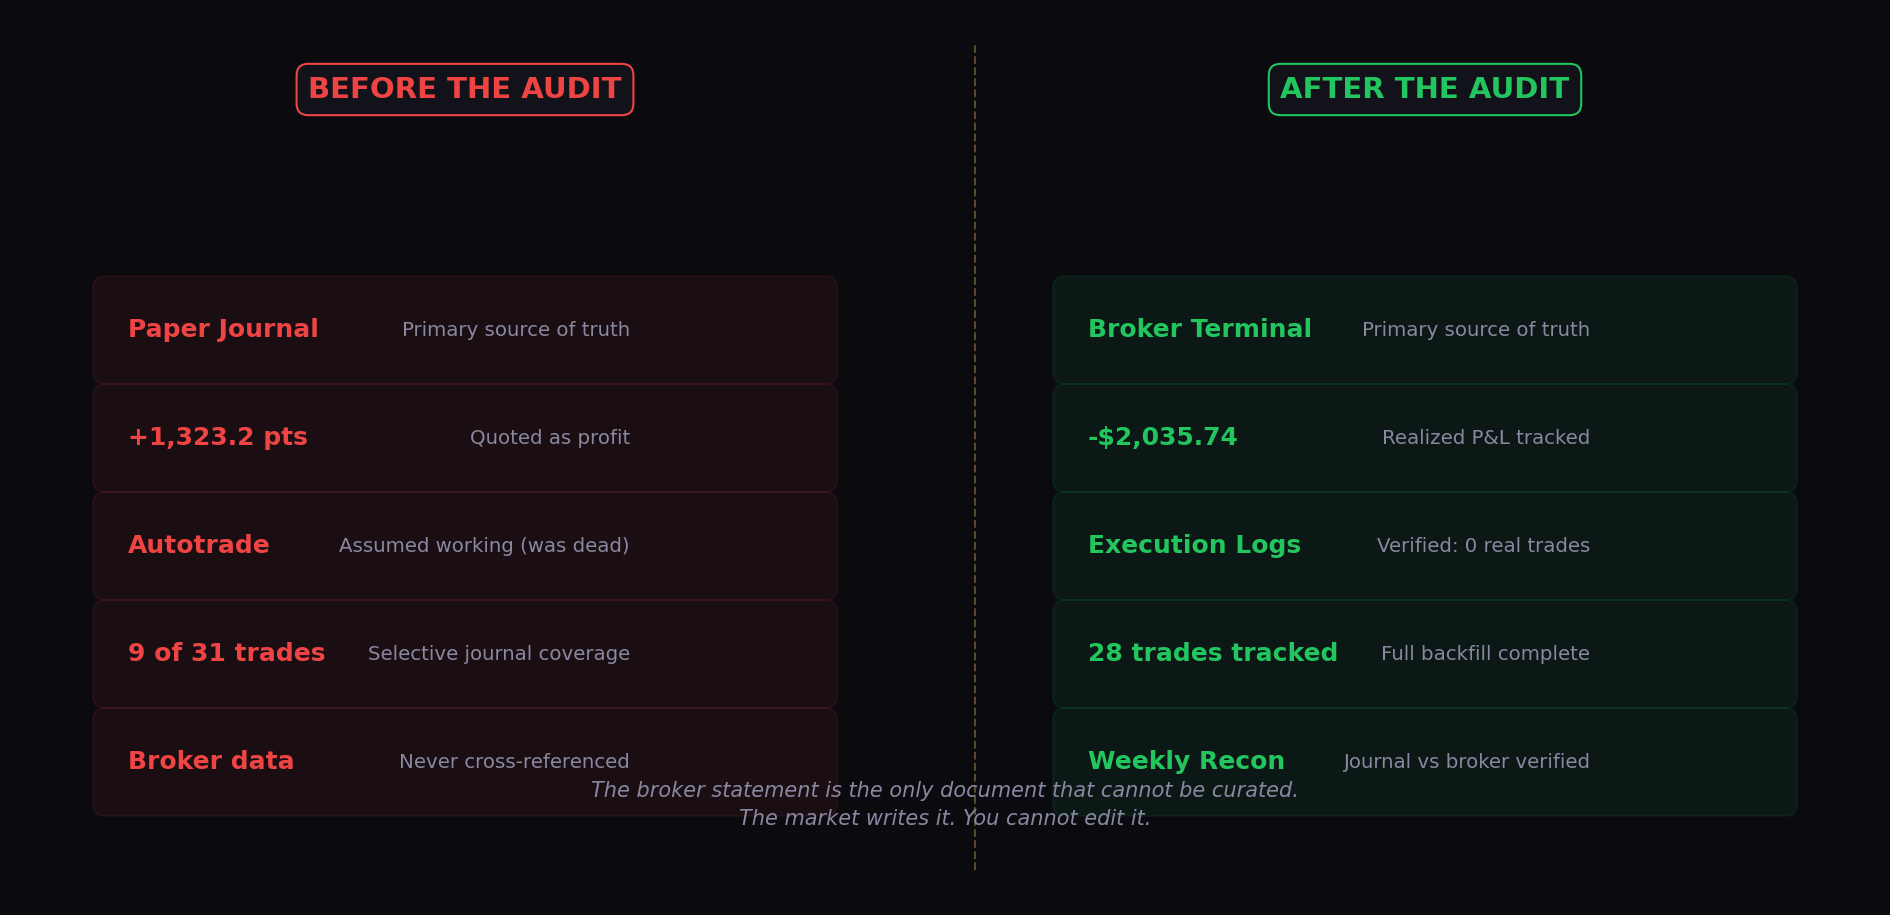
Figure 4: Before and after the audit. Left side: signal journal as primary truth with no broker cross-reference. Right side: broker terminal as primary truth with explicit signal-vs-realized P&L separation.
The Architecture Principle
After the zone defense article and now this audit, a pattern has emerged in how I think about trading systems. It's not about entries and exits. It's about truth hierarchies.
Every trading system has multiple layers of data:
- Signal data — what the algorithm thinks it sees (cheapest to produce, most abundant, least reliable)
- Journal data — what was recorded as having happened (depends on logging discipline, subject to selective omission)
- Runner log data — what the system actually processed (harder to fake but still internal to your code)
- Broker data — what your counterparty recorded (external, authoritative, the only layer that determines your account balance)
💡 The Truth Hierarchy Rule
Never quote a higher layer as truth when a lower layer is available. If you have broker data, your journal is supplementary. If you only have a journal, your signals are supplementary. P&L claims without broker verification are not analysis — they're storytelling. And storytelling doesn't pay margin calls.
This sounds obvious. But almost nobody in trading content follows it. Backtests are presented as evidence. Signal journals are presented as track records. Screenshots of green days are curated into narratives of consistent profitability. The broker statement is the only document that cannot be curated. The market writes it. You can't edit it.
Trade With a System That's Honest About Losses
We're building trading systems at MP Signal that don't hide from their broker statements. The three-layer zone defense we deployed last week blocks buy signals at H4 extremes. The signal journal now explicitly separates "hypothetical signal P&L" from "realized broker P&L." And every Monday morning, the system runs a broker reconciliation — comparing what the journal claims against what the terminal recorded.
This article exists because I failed to do this for six months and paid $2,035.74 to learn the lesson. You can learn it for free in 20 minutes.